What your Postgres is waiting for, and why the dashboard can't tell you

A checkout request was slow. The dashboard said the time went to the commit path and to disk reads. The team tried the two fixes that follow from that, and the slowest requests stayed about as slow. The cause was a lock that the dashboard ranked fifth, at 2% of the time. This post explains why a wait dashboard can be right about the time and wrong about the problem, using only what Postgres exposes today. It ends where the next post, about a tool that finds such causes, begins.
A wait dashboard tells you where the database spends its time, not why a request was slow:
- Every Postgres wait dashboard samples a live flag; it cannot count waits, time them, or follow one request
- In a measured checkout workload the dashboard's two suggested fixes (async commit, more memory) left the tail (p99.9 and the worst requests) unchanged
- The cause was a row lock at 2% of the dashboard; fixing it cut slow requests by 60% in the original run, and by 100%, 92% and 27% in three repeats on a faster VM with unrelated stalls
- The tools that found it exist today only as a Postgres patch under review and as an eBPF tracer that needs host access
What a wait event is
When a Postgres backend is about to wait for something, it writes a 4-byte code for the wait into its own slot in shared memory. When the wait ends, it clears the slot. pg_stat_activity turns the code into a type and a name when you read it; the names look like Lock:transactionid, IO:DataFileRead or Client:ClientRead. There are about 275 of them in Postgres 18, more with every release, in ten types, listed in the wait event table of the documentation. You read the slot through pg_stat_activity.wait_event.
That is the whole mechanism. No clock is read, nothing is counted, nothing is logged. A wait event is a live flag that says "right now, this backend is inside this wait". One note on what the flag covers: the backend sets it just before it goes to sleep and clears it only after it wakes up and runs again. If the CPU is busy, the time between being woken and getting a CPU back is inside the wait. So a wait is "not running, and here is the name", not a pure measurement of blocking.
Two kinds of time
A request's time is time on a CPU plus time waiting for something else. EXPLAIN ANALYZE shows where the time went by plan node: which nodes ran, how many rows each produced, where the estimates were wrong. With track_io_timing it also reports I/O time. Its node times are elapsed time, so waits are inside them, but it does not say which part was waiting, or on what. A query that spent 90% of its life blocked on a lock produces a plan in which every node looks healthy, with one large number and no indication that the number is waiting rather than work.
Wait events are how Postgres reports the second kind of time. But they report only the wait that is in progress now.
How every dashboard sees waits
Because the flag is live and nothing is recorded, every tool built on wait events uses the same technique: read the flag on a timer and count what you saw. The count for each event divided by all counts is a share of time. pg_wait_sampling does this inside the server every 10 ms by default. Managed-service dashboards do the same with a UI on top: Amazon RDS Performance Insights, Azure Database for PostgreSQL query store. So do the monitoring products: pganalyze, Datadog Database Monitoring, pgwatch, and our own PostgresAI monitoring.
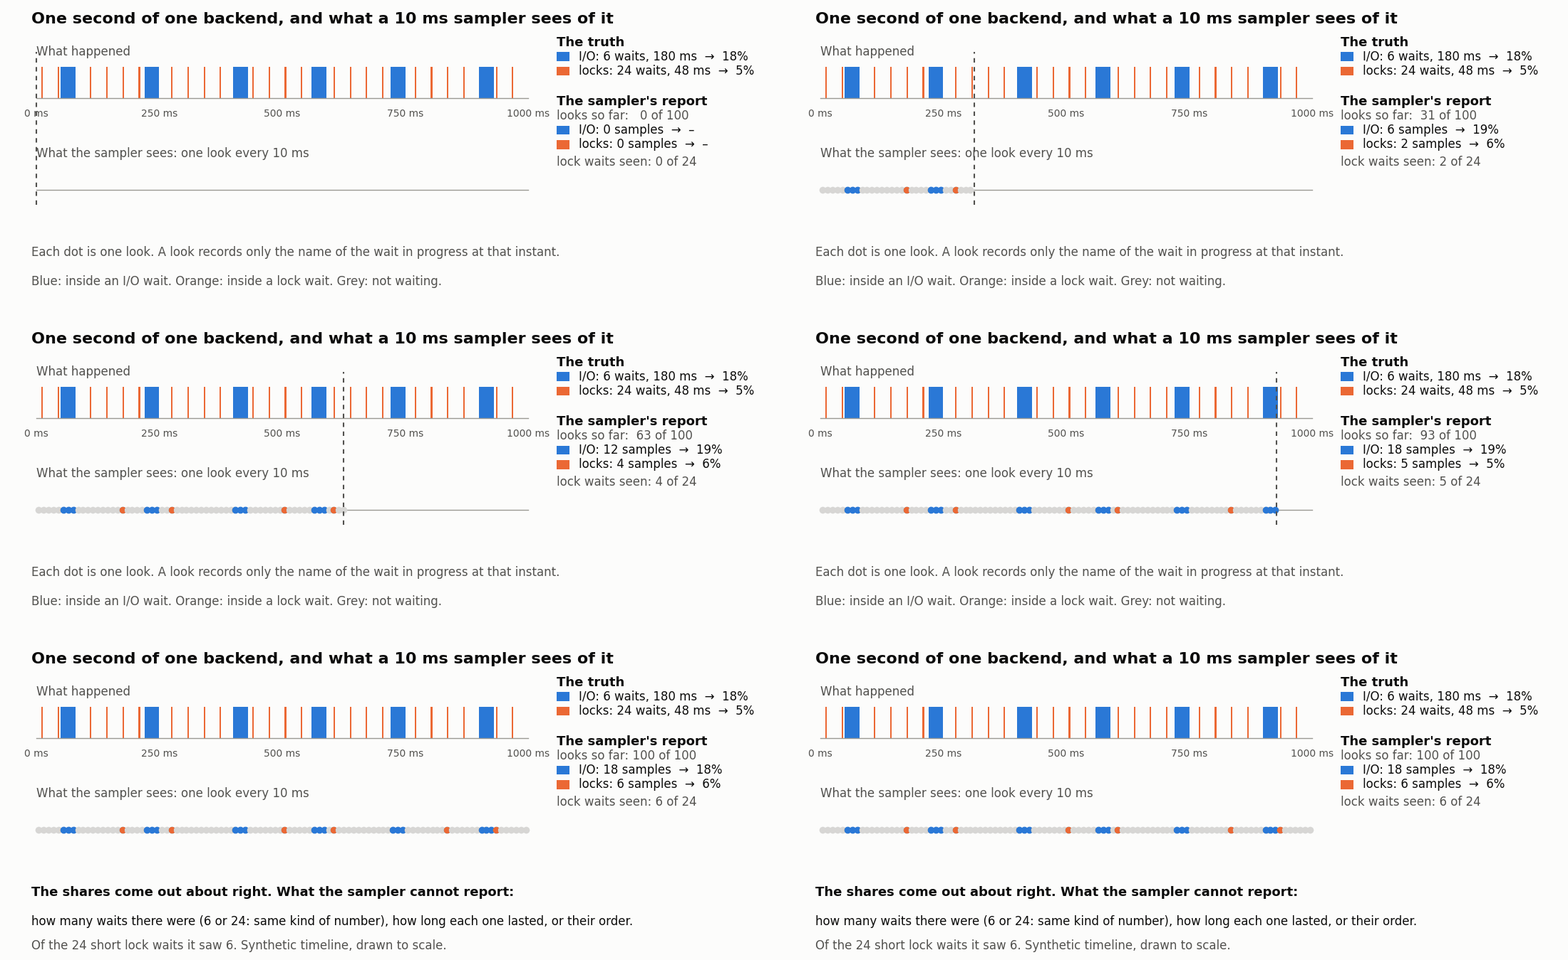
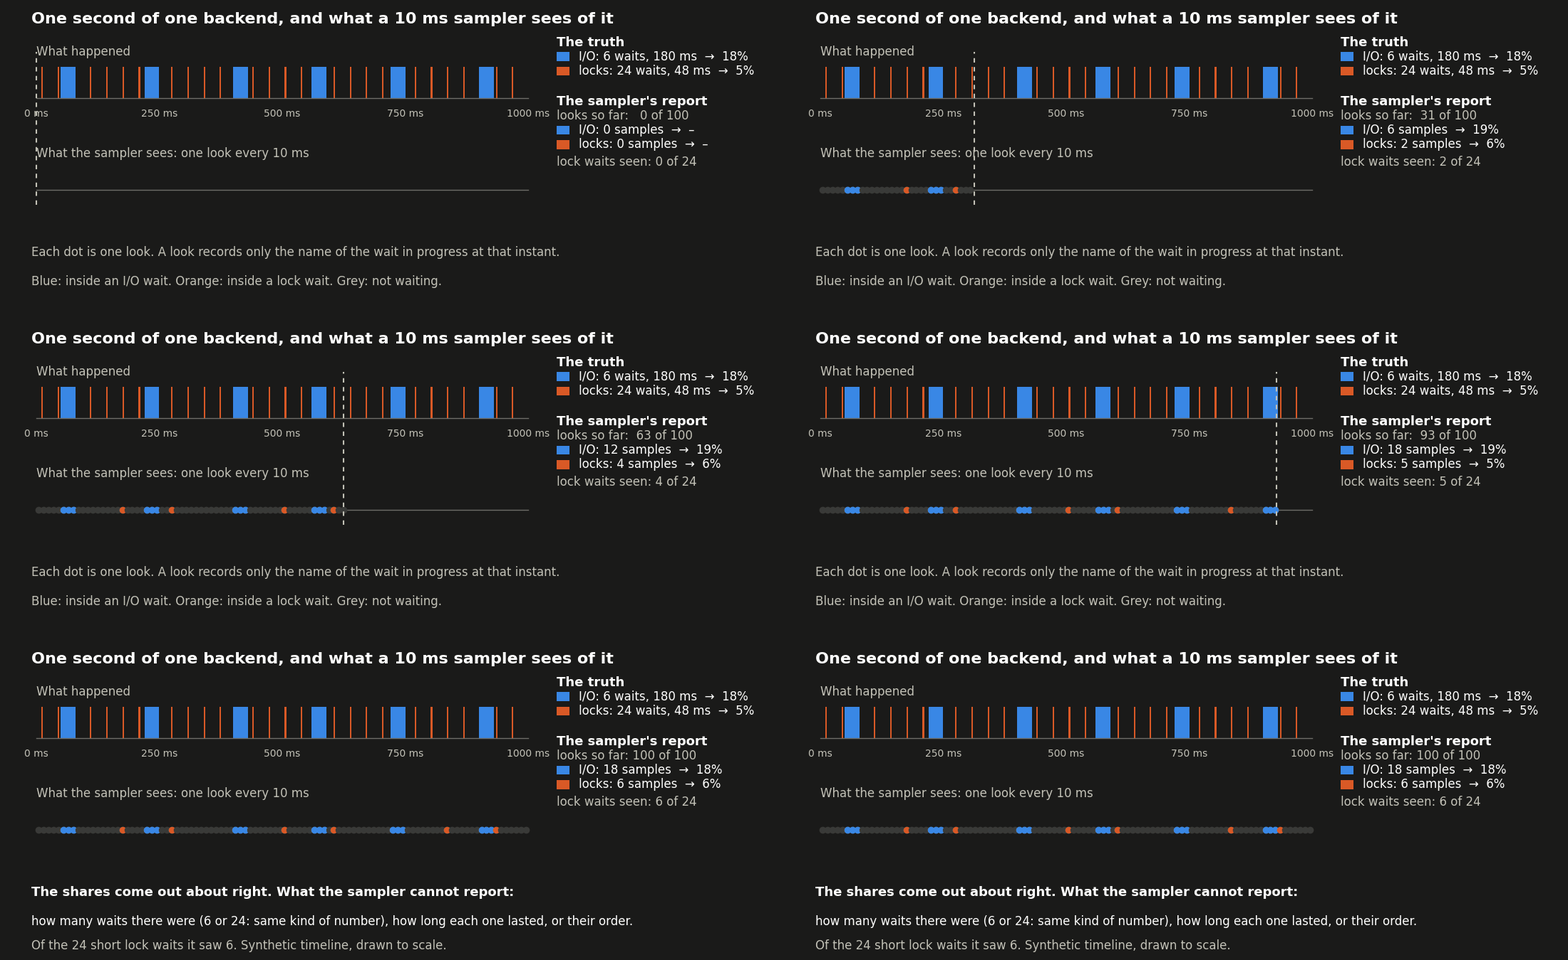
Sampling works. The shares it produces are unbiased estimates; with enough samples they come close to the exact shares. In the incident below they matched exact timing within about 2 percentage points. It points at the right subsystem cheaply and continuously, with no setup before the incident. Most of the time it gets you close to a fix.
Three things a share cannot tell you
How many waits, and how long each. A share is a product: the number of waits times their average length. Six seconds of IO:WalSync in a minute can be 30,000 WAL flushes at 200 µs, which is a healthy disk under high commit volume, or 300 flushes at 20 ms, which is a disk that stalls. Same share, different fix. For two classes of waits, Postgres keeps counts and totals elsewhere: pg_stat_io for I/O (WAL included from Postgres 18; times need track_io_timing, or track_wal_io_timing for WAL), and in Postgres 19 (a release candidate since October 2026) pg_stat_lock for heavyweight-lock waits that lasted longer than deadlock_timeout and were acquired. Those give you a mean. A mean still cannot tell 30,000 flushes of 200 µs from 29,700 of 100 µs plus 300 stalls of 10.1 ms: same count, same total, same mean.
Waits shorter than the sampling interval. A 2 ms wait leaves a sample in about one look out of five. Twenty of them in an hour are 40 ms out of 3,600 seconds, and a 10 ms sampler taking 360,000 looks lands inside one of them about four times, on average. From four samples you learn neither the count nor the durations.
What one request went through. A sample is a state, not a transition. A sampler with history (pg_wait_sampling keeps the last 5,000 samples by default, a few seconds on a busy server) keeps the order of the states it saw, but not where one request ended and the next began, not how long any wait lasted, and nothing between two looks. The question "why was this request slow" has no answer in a share.
The tools you already have
| Question | Tool | What it gives |
|---|---|---|
| Who is blocking whom, right now | pg_locks, pg_blocking_pids() | the blocker's PID while the wait is in progress |
A lock wait longer than deadlock_timeout | log_lock_waits (off by default through Postgres 18, on by default in Postgres 19) | a "still waiting" line with the holders and the queue once the wait passes deadlock_timeout (1 s by default), and an "acquired ... after N ms" line when the lock is granted |
| Totals per statement | pg_stat_statements | calls, total and mean time, blocks read; no wait breakdown |
| I/O counts and times | pg_stat_io, per backend pg_stat_get_backend_io() | exact counts and totals per operation type; no distribution, no worst case |
| Heavyweight-lock counts and times | pg_stat_lock (Postgres 19) | waits over deadlock_timeout that were acquired, by lock type |
| Where a plan spends its time | EXPLAIN (ANALYZE, BUFFERS) | per node elapsed time and I/O time |
| Where the server's time goes, continuously | a sampler: pg_wait_sampling or a dashboard | shares of time per wait event and per query |
They were all available below. The lock waits lasted from a few to about 20 ms, far below the 1 s deadlock_timeout that log_lock_waits and pg_stat_lock need, and too short to catch with pg_blocking_pids() by hand. The question still had no answer.
One incident: the slow checkout
Everything that follows is a reproduction built to match a pattern we keep seeing. The scripts, the READMEs and the summaries are in the checkout-tail-20261022 and reruns-20261023 directories of the pg_wait_tracer repository; the per-request logs and trace rings they summarize are in the evidence-20261023 release. The figures in this post are generated from that data by the scripts in static/assets/blog/src/20261103-wait-events-1/ of this site's repository. All runs are plain SQL on a real disk: no pg_sleep, no injected delays.
An online shop's checkout does three things in one transaction: look up a catalog row, which is often a real disk read because the catalog does not fit in memory; update one of 1,000 stock rows; commit. Sixteen clients send 2,000 of these per second through pgbench. A typical request takes 1.5 ms. There is a tail at 10–25 ms. Latency is counted from each request's scheduled start, as pgbench does at a fixed rate. The runs in the tables use a development build of Postgres (20devel) with the tracing patch of the next post loaded but switched off; a repeat on stock Postgres 18 gives the same sampler picture (Lock:transactionid 3.0%) and the same cause of the tail.
A background job recalculates reserved stock. About five times a second it runs one update over 100 consecutive items, which takes about 17 ms, and it holds the row locks on those 100 items until it finishes.
What the dashboard said
pg_wait_sampling, on the request backends, over a 120 s window, with Client:ClientRead (time spent waiting for the client) removed:
| Wait event | Share |
|---|---|
LWLock:WALWrite | 32.7% |
IO:WalSync | 29.3% |
| CPU | 22.4% |
IO:DataFileRead | 12.3% |
Lock:transactionid | 2.3% |
CPU is our label for samples where pg_wait_sampling reports no wait event (NULL): time on a CPU, or a wait that Postgres does not instrument. By query, COMMIT holds 78% of the samples. The commit path, then disk reads. That is the picture any wait dashboard would show for this workload, and it is correct about where the time goes.
The two fixes it suggests, tried
The commit path at the top says: make commits cheaper. The reads say: add memory. Both were tried, and a third fix was tried later for comparison.
| Run | Change | Mean | p99 | p99.9 | Max | Requests over 5 ms |
|---|---|---|---|---|---|---|
| baseline | 1.51 ms | 3.08 ms | 10.98 ms | 26.7 ms | 972 | |
| fix A | synchronous_commit = off | 0.83 ms | 1.74 ms | 11.36 ms | 25.7 ms | 688 |
| fix B | 2 GiB shared_buffers, prewarmed, no memory limit | 1.34 ms | 2.82 ms | 11.30 ms | 23.9 ms | 954 |
| fix C | background job in 5-row chunks | 1.52 ms | 2.92 ms | 5.78 ms | 10.0 ms | 388 |
Fix A halves the mean and gives up durability on a crash. The tail does not move. Fix B removes the disk reads. The tail does not move. Fix C changes nothing in the database's configuration, and it is the only one that moves the tail: p99.9 from 11.0 to 5.8 ms, the worst request from 26.7 to 10.0 ms.
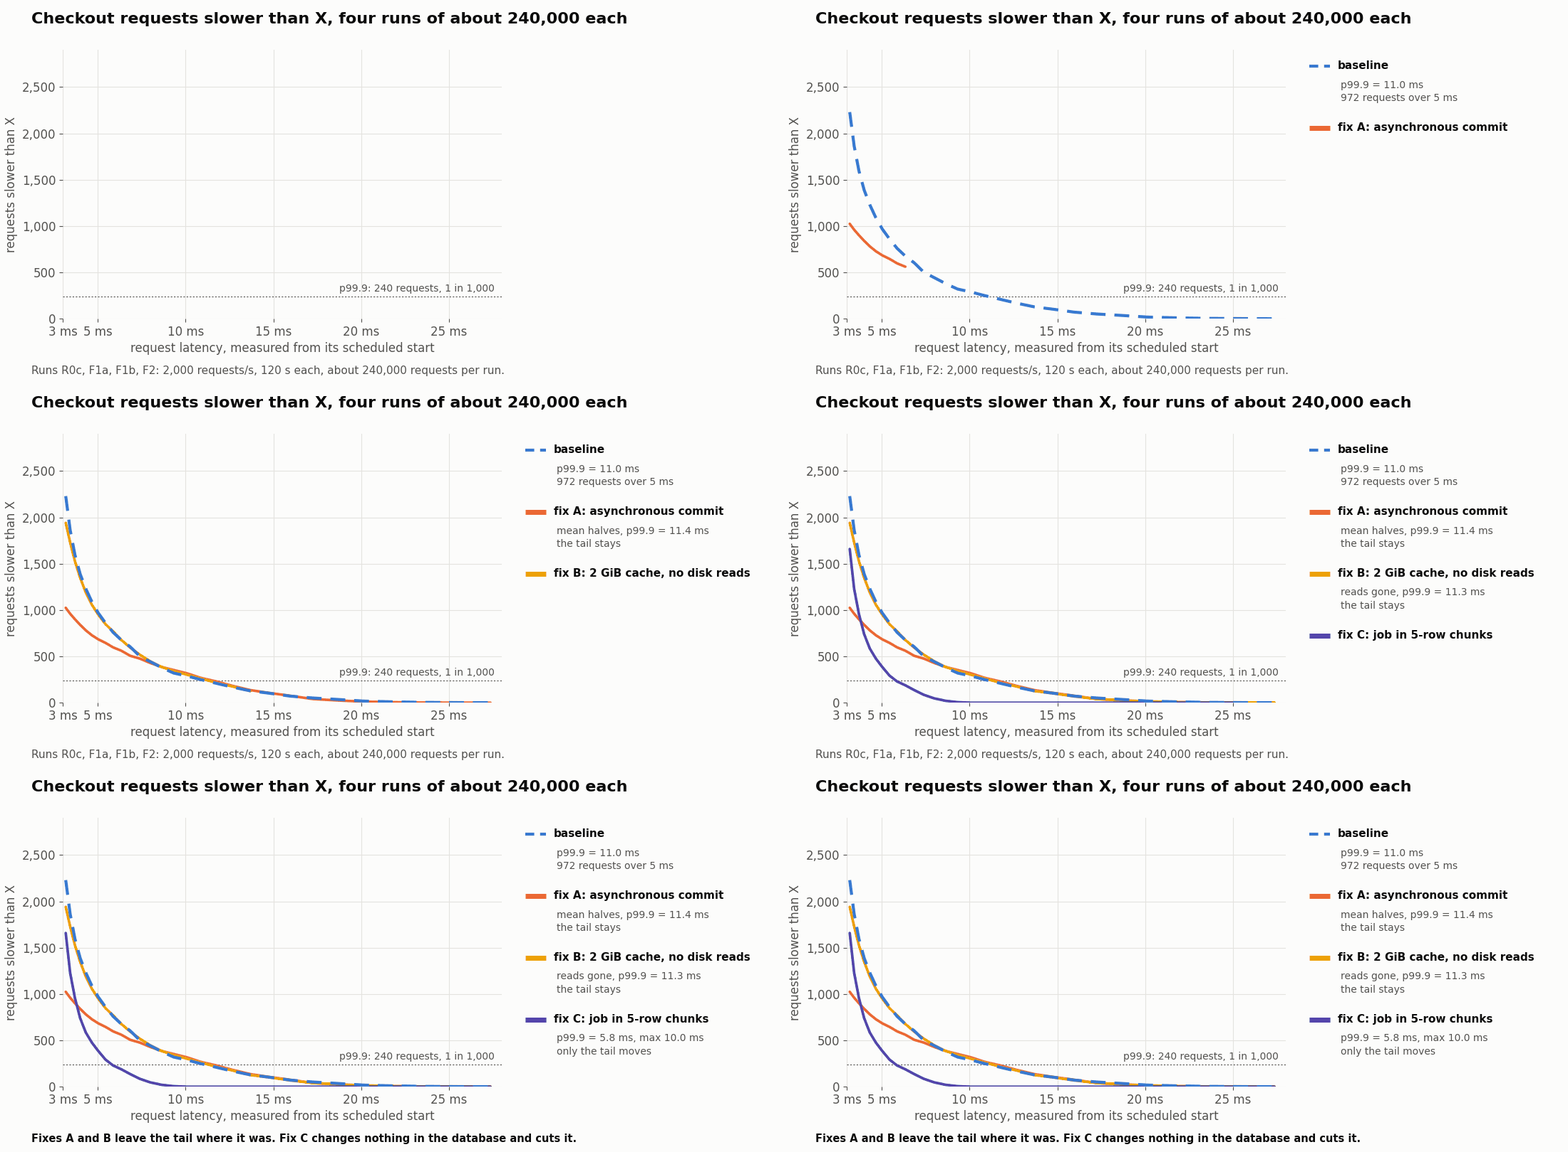
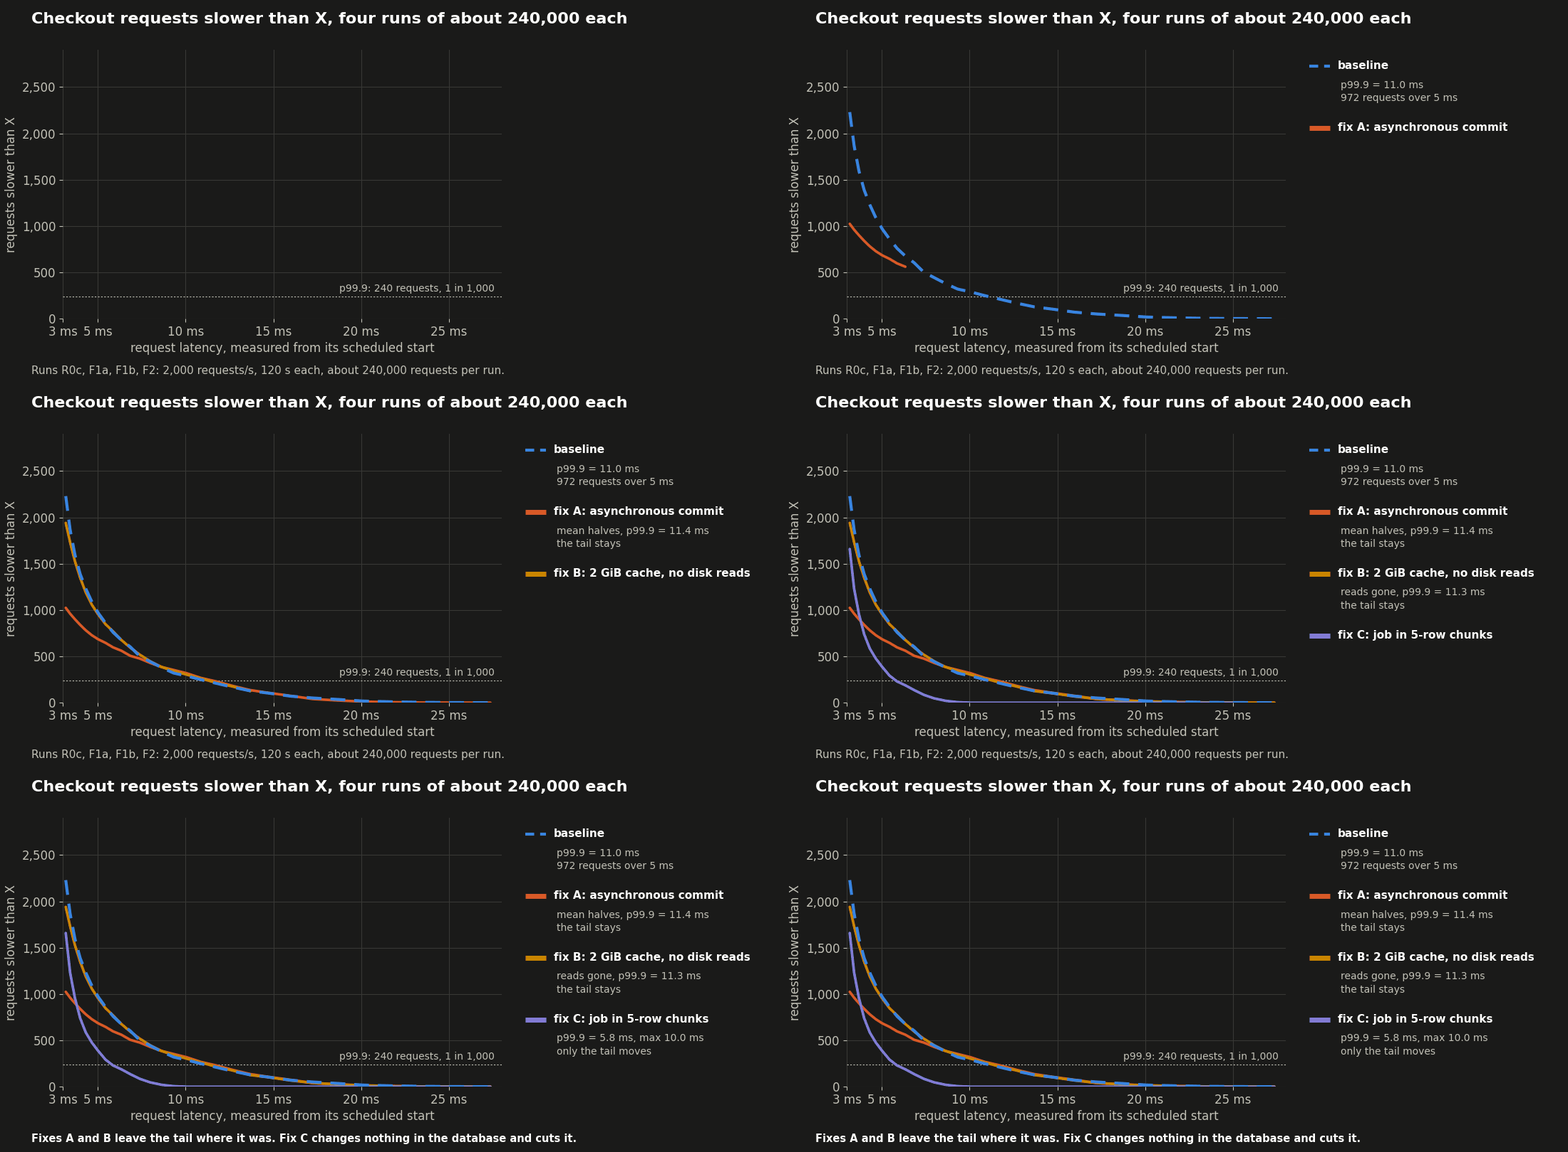
No share pointed at fix C. Here is how it was found.
What made the slow requests slow
The baseline run was repeated with exact per-wait timing turned on: every wait with its duration, and markers where each statement and transaction began and ended. That run covers about 50 seconds: 107,533 requests rebuilt from their own waits, of which 579 took more than 5 ms of server time. (The table above counts latency as pgbench sees it, over 120 s, so its numbers are larger.) That makes it possible to rebuild each request from its own waits and ask, for the slow ones only, what they waited on. The tool that recorded this is the subject of the next post; here only its answer matters.
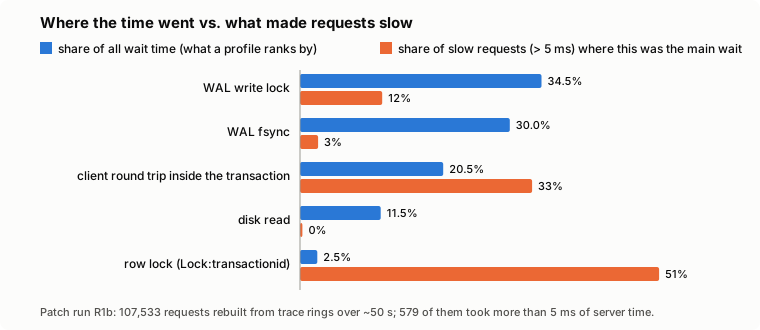
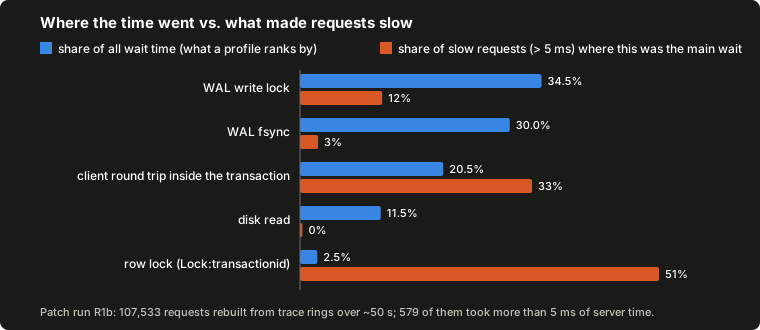
The left bars are exact wait time, and for the waits both views measure they agree with pg_wait_sampling (LWLock:WALWrite 34.5% against 32.7%, Lock:transactionid 2.5% against 2.3%). The client round trip bar has no row in the sampler table, which removed ClientRead, and the sampler's CPU row has no bar here. The right bars are the view per slow request. Lock:transactionid is 2.5% of all wait time and the main wait in 51% of the requests that took more than 5 ms; at an 8 ms threshold it is 65%. Half of the slow requests, and two thirds at 8 ms, are ones that landed on a stock row the background job was holding. The mean never moved because the lock-bound requests are about 0.3% of all requests.
A third of the slow requests were slow on the client side instead: the backend sat in Client:ClientRead inside the open transaction, waiting for pgbench to send the next statement. That is the load generator's delay, not the database's, and it too is visible only per request. ("Main wait" means the wait event whose waits together cover at least half of the request's server time; a request with no such wait counts as CPU or other.)
One of them:
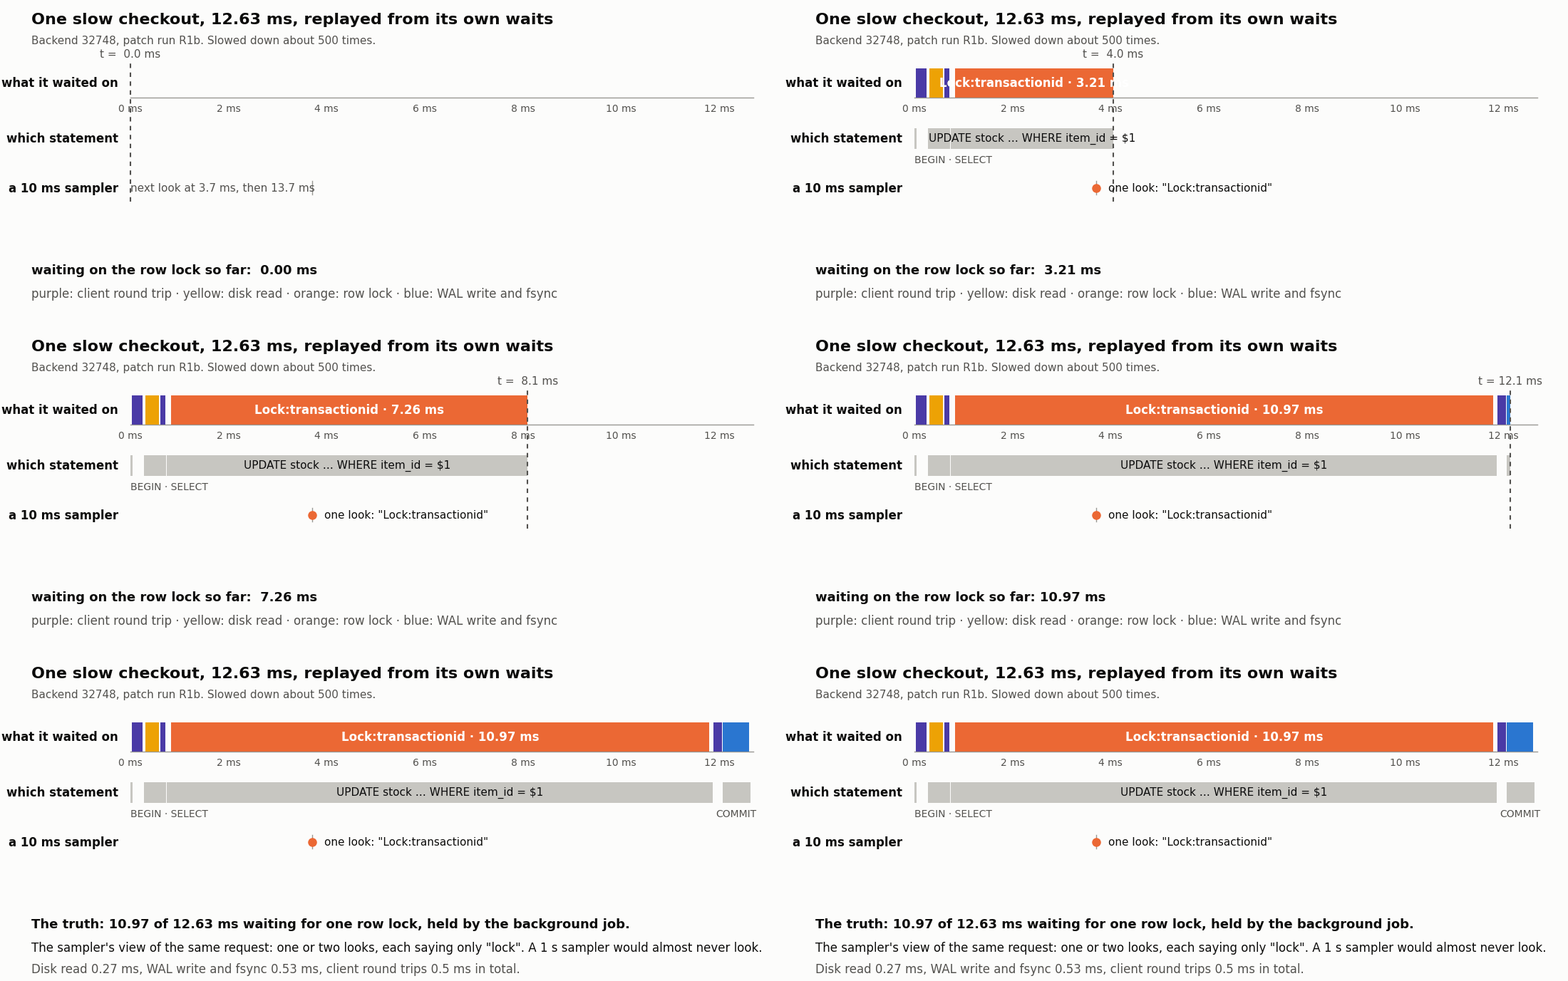
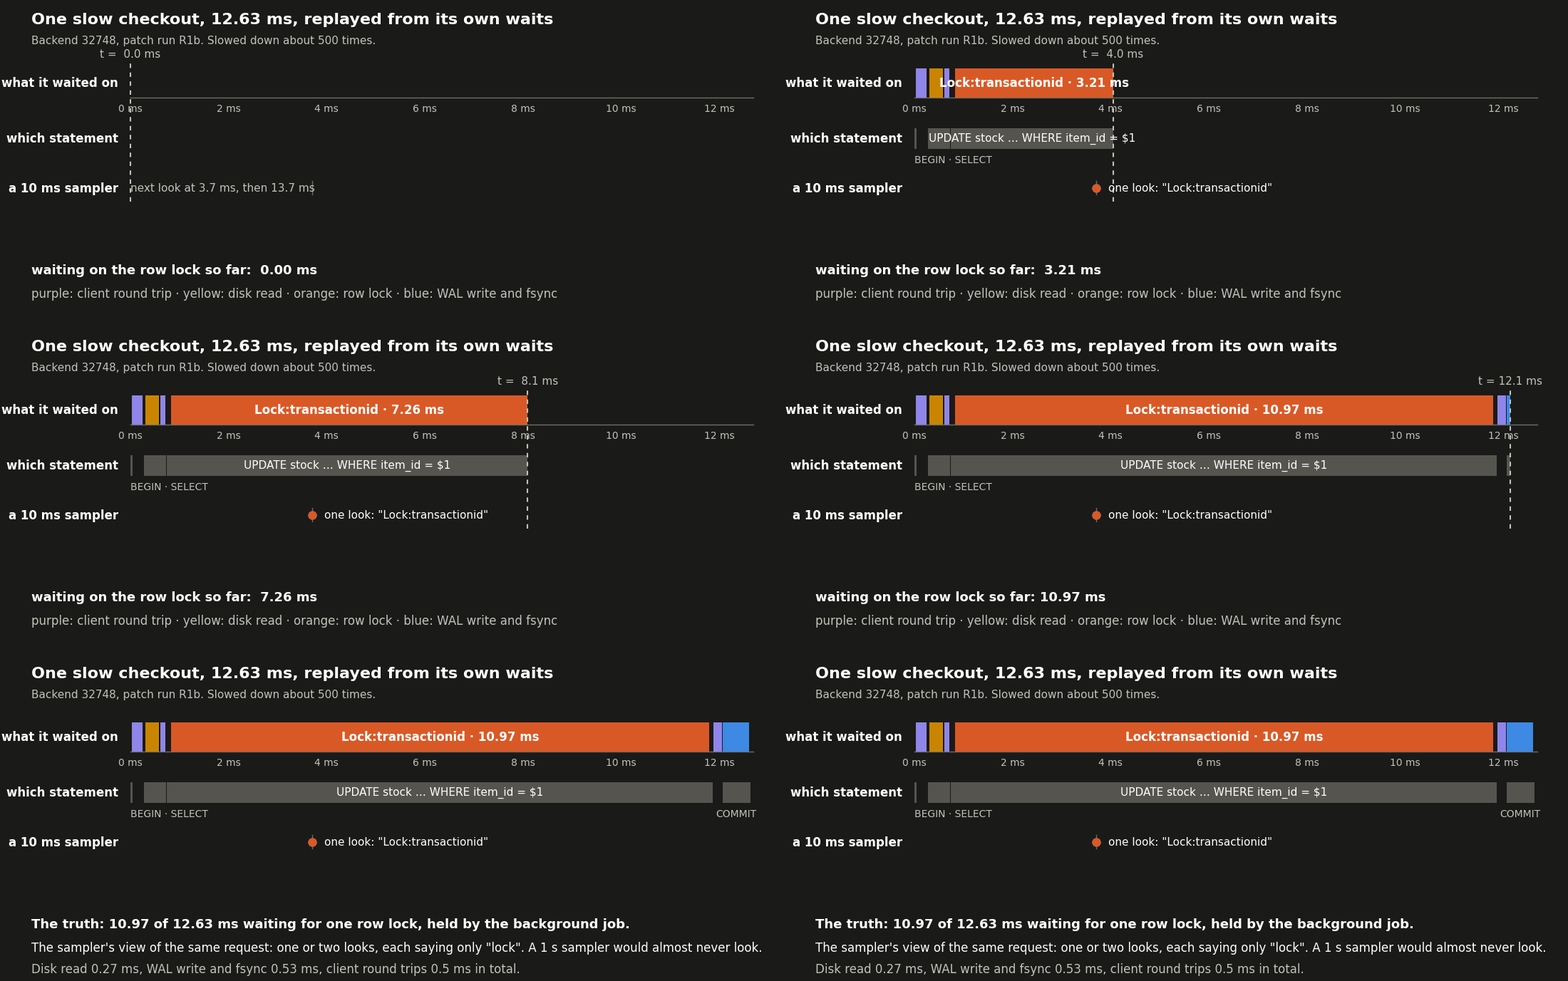
The request spent 87% of its life waiting for one row lock. The disk read that the dashboard ranked high took 0.27 ms. The commit path that the dashboard ranked first took 0.53 ms (WAL write and fsync).
The fix, and the repeats
If the job holds 100 row locks for 17 ms, hold fewer for less time. Fix C runs the same job as 20 statements of 5 rows each. Each statement takes about 1 ms of server time (pg_stat_statements: 0.97 ms on average over 11,879 calls), so each row's lock is held for about 1 ms instead of 17. The job is not cheaper: with 20 round trips it takes about 41 ms per run instead of 18. That is the whole change.
The fix ran once on the original VM, which is the table above. It was then repeated three times, alternating with three baseline runs, on a re-created VM. Two things were different there. The new VM was faster, so the job took 8 ms instead of 17 and the lock tail was smaller to begin with. And four of the six runs had short stalls of 10–150 ms, a few per run, that hit every request at once in both arms; their cause was not found, so the comparison excludes the moments when at least 20 requests were late at the same time, a condition that never occurs in any of the original runs. With that exclusion, requests over 5 ms, baseline against fix C: 125 against 0, 300 against 24, 334 against 245. Most of the 245 in the last pair (158 of them) arrive within half a second after a stall, as the backlog drains. pg_wait_sampling's own per-query view agrees: the stock update's Lock:transactionid share fell from 22% to 0–1%.
What the dashboard could have shown
An expert could have found a hint. pg_wait_sampling's per-query view shows the stock update at 41% Lock:transactionid, and someone who drills into that one statement sees lock waits. What no share can say is that these waits, and not the commit path at about 27 times their size, are what makes the tail. For that you need the waits of each request, with their durations, in order.
What to take from this
A wait dashboard answers "where does the server spend its time", and in this incident it answered correctly. It does not answer "why was this request slow" when the cause is rare, short, or small in total. For that question you need every wait with its duration, grouped by the request it belonged to. Nothing in a released Postgres records that today.
Two things do, each with a price. One is a patch under review on pgsql-hackers, pg_wait_event_tracing (commitfest entry, code), which records every wait inside the server; it produced the numbers above, and it needs a patched build. The other is pg_wait_tracer, an eBPF tool that watches the same flag from outside the server on a stock Postgres; it reached the same conclusion on this workload, and it needs root on the host. The next two posts cover them in turn, including what each one costs while it watches.
Which waits, in which order, for this one request? Next: the patch that records them.
If you prefer the talk version, this incident and four others were presented at PGConf.EU 2026: Stop guessing: unlocking wait events at scale with existing and new tools (slides).