#PostgresMarathon 2-005: More LWLock:LockManager benchmarks for Postgres 18


In 2023-2024, after incidents that multiple customers of PostgresAI experienced, when production nodes were down because of LWLock:LockManager contention, we studied it in synthetic environments.
At that time, we managed to reproduce the issue only on large machines – ~100 or more vCPUs.
With PG18 release (and its fast-path locking improvement, commit c4d5cb71d), this question started to bother me again: can we experience LWLock:LockManager on smaller machines?
Denis Morozov just published results of benchmarks that successfully reproduce LWLock:LockManager contention in PG18 on 16-vCPU VMs.
As before, we took standard pgbench, with -s100 (no partitioning), and started running the standard "--select-only" workload that SELECTs random rows in "pgbench_accounts". Originally, the table has only 1 index – so at planning time, Postgres locks 2 relations with AccessShareLock; then we add one more index at each step.
Then we change max_locks_per_transaction from default 64 down to 32 and up to 1024. We couldn't set it to 16 (which, I expect, would make behavior of PG18 similar to PG17 in terms of fast-path locking – 16 slots only), because in our setup, Postgres is managed by Patroni, and there, as it turned out, there is a hardcoded minimum for max_locks_per_transaction, 32.
And here is what we have for the planning time:
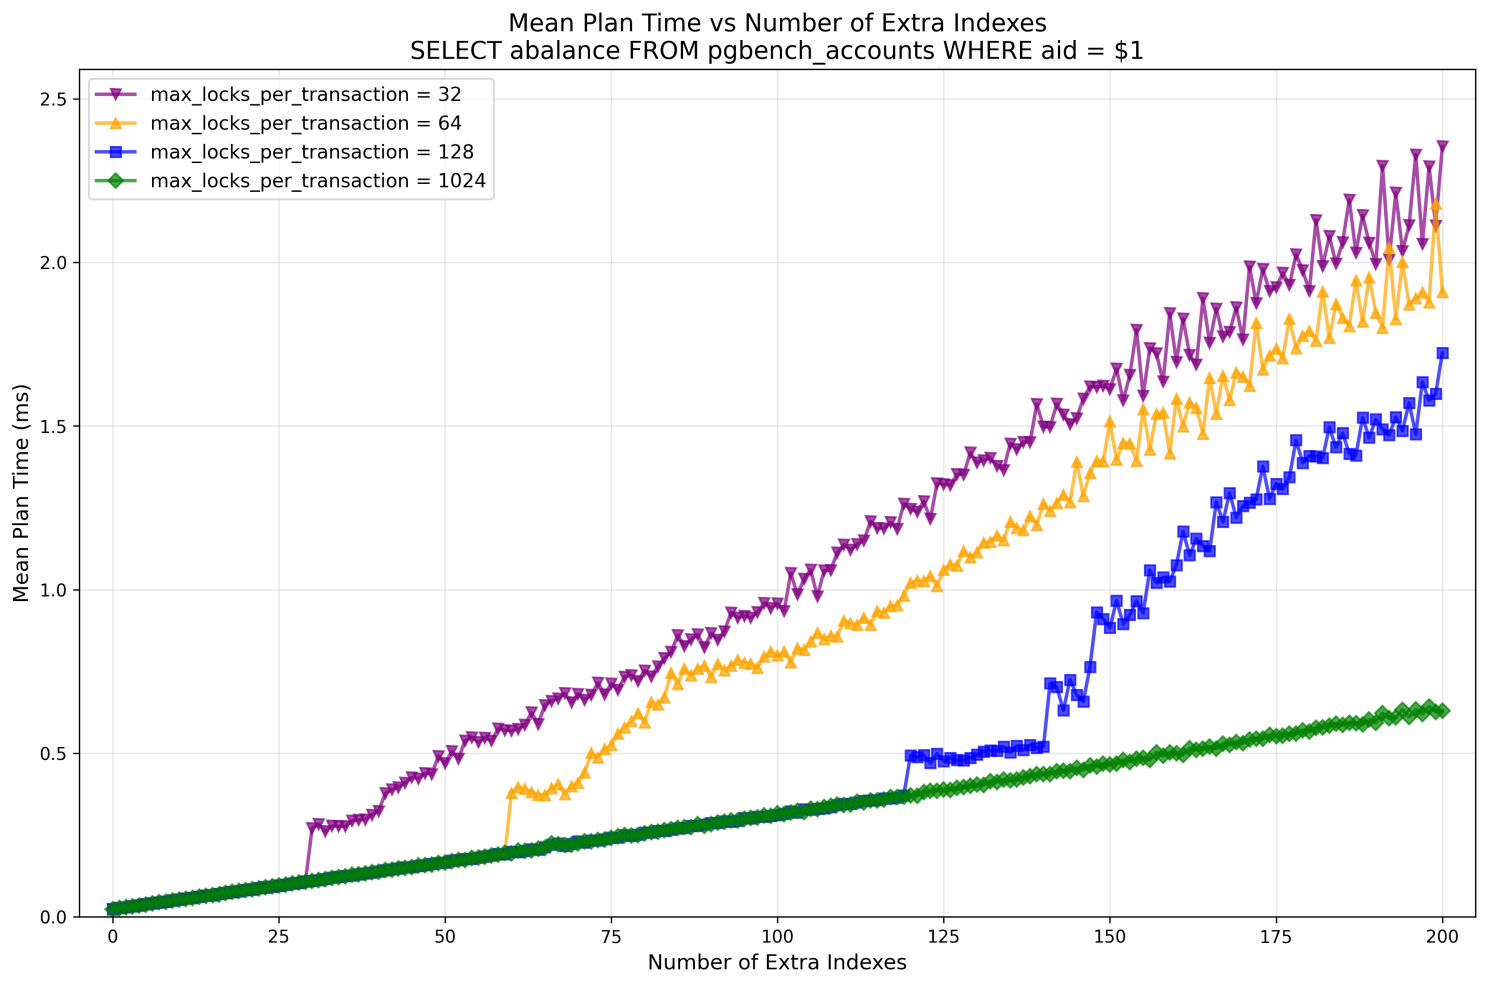
-- it is clear that when we're out of fast-path lock slots and Lock Manager starts using the main lock table, it affects the planning time. The infamous LWLock:LockManager performance cliff, reproduced on a moderately sized machine.
For max_locks_per_transaction=1024, the issue wasn't observed, with the number of extra indexes up to 200 (total number of locked relations 202).
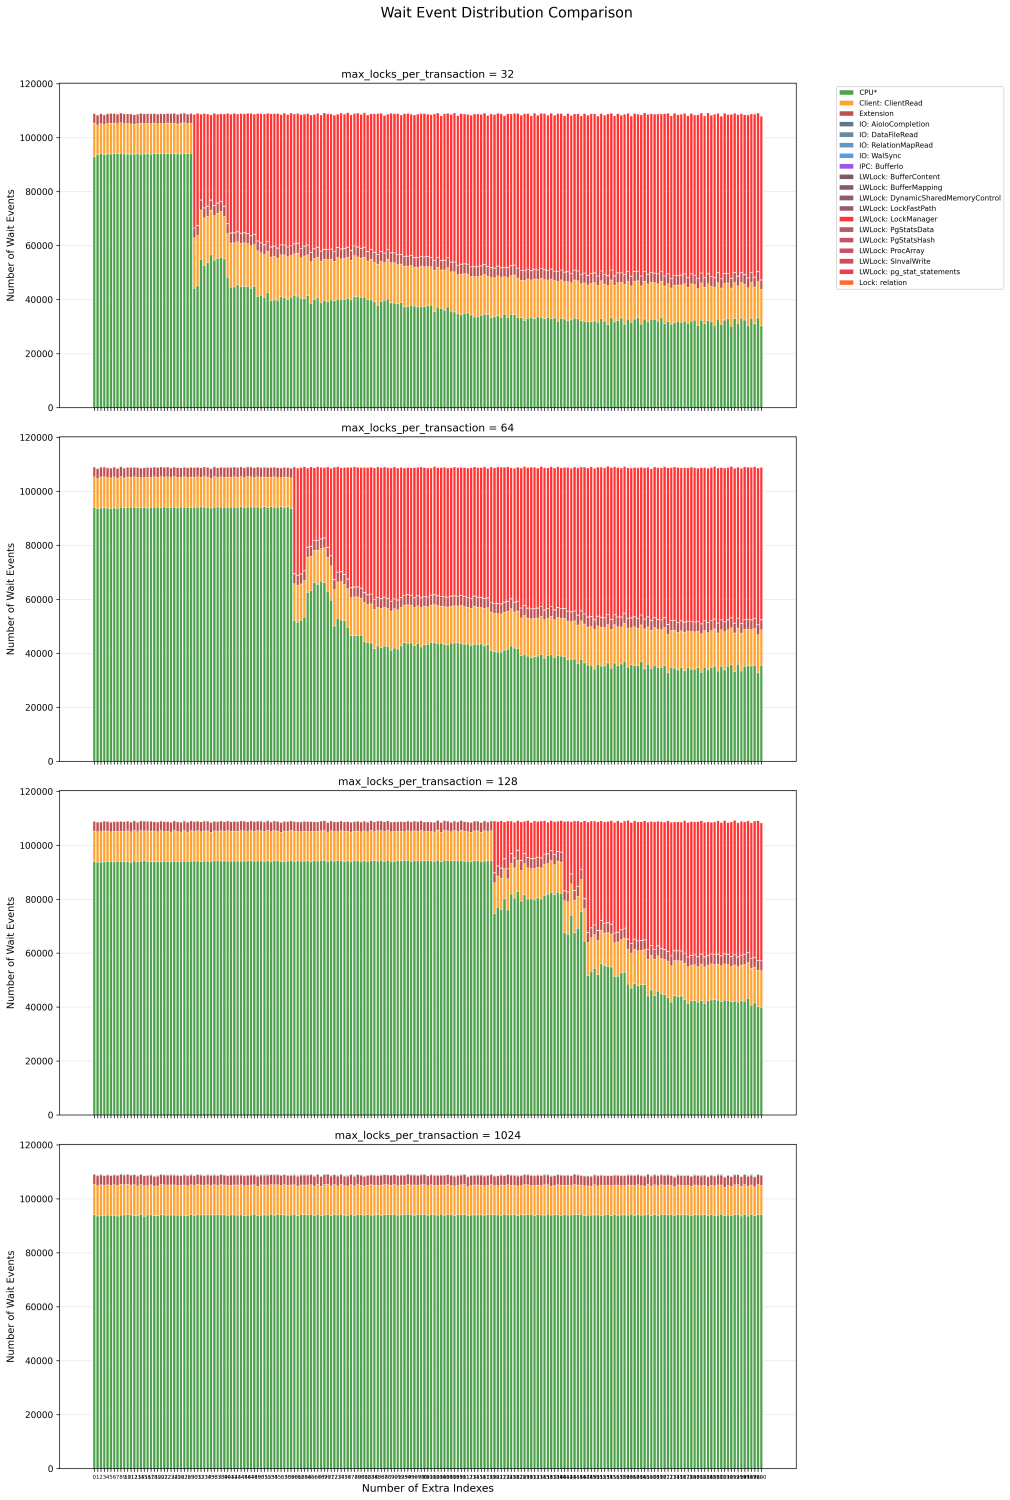
The wait event analysis clearly confirms the LWLock:LockManager contention:
We plan to conduct this benchmark for PG17 to have a clear comparison, and then, perhaps, revisit smaller machines, e.g., with 8 vCPUs – I'm very curious to understand if smaller Postgres instances can experience this type of problem.
Another interesting observation was execution time:
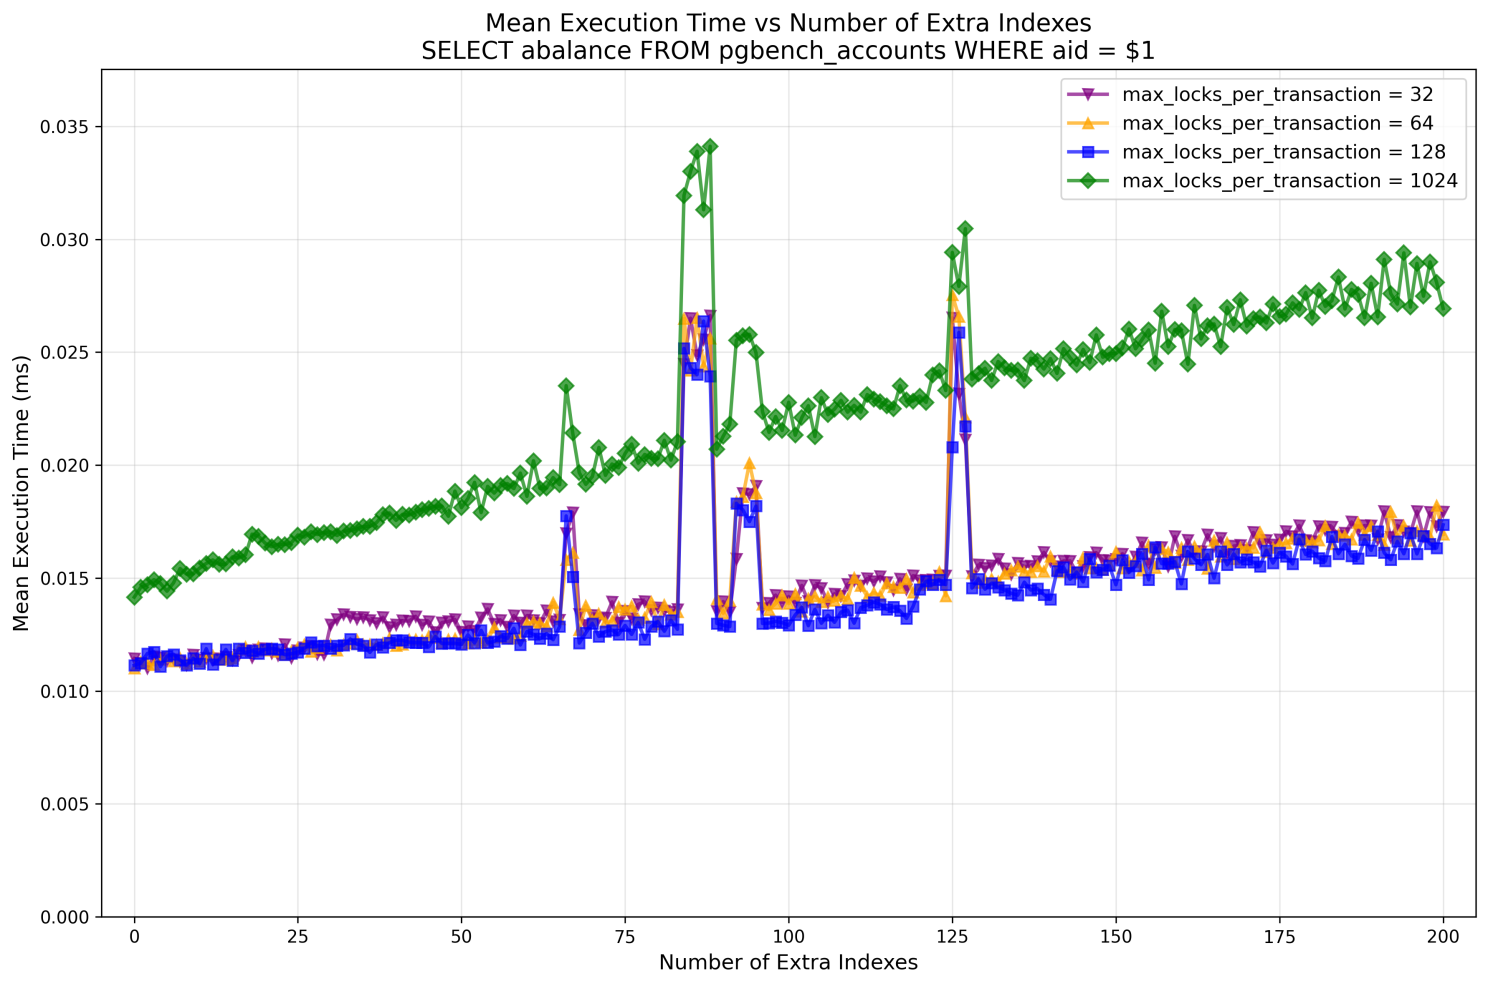
I'm not really concerned by occasional spikes, this could be noisy neighbors (for a specific number of indexes / relations locked, we run iterations of all variants of max_locks_per_transaction at ~ the same time, this explains the nature of the spikes).
But notice the very different growth of execution time for max_locks_per_transaction=1024. Remember I ended 2-004 with a question: are there downsides of the optimization in PG18? I couldn't find any so far, in the optimization itself. But the downsides of having too large max_locks_per_transaction (except the obvious one – memory consumed), definitely exist, and this looks like one of them. Worth a separate analysis?
Let me know what you think about all this, what questions you have, and what max_locks_per_transaction you're going to have in your production systems -- default 64 or something else.