postgres_ai monitoring – expert-level Postgres monitoring tool for humans and AI


Today we're releasing postgres_ai monitoring v0.7, an open-source monitoring solution built specifically for Postgres experts who need rapid root cause analysis and deep performance insights. This isn't a tool for beginners—it's designed for experienced DBAs and SREs who need to understand complex performance issues in minutes, not hours.
Want to see it in action? Try our live demo (login: demo / password: demo) to explore the dashboards and see real-time Postgres monitoring in action.
Why we built this
The evolution from two tools to one
For years, we've been using two separate tools internally:
- pgwatch2 postgres.ai edition: Our fork for continuous monitoring
- postgres-checkup: Our deep health check tool
Over the past year, we've conducted 30+ comprehensive health checks for 20+ companies, accumulating extensive experience in Postgres troubleshooting patterns. postgres_ai v0.7 represents the convergence of these tools, combining real-time monitoring with deep analysis capabilities.
Built for experts, both human and AI
This solution supports two types of experts:
- Human experts who need quick-and-shallow views during incident response ("I have 1 minute to understand where to dig deeper")
- AI systems that require structured, comprehensive data for analysis
Top-down troubleshooting methodology
Our tool embodies a "macro to micro" philosophy, guiding you through a structured, top-down troubleshooting workflow. Start with the big picture using the Four Golden Signals, then pinpoint system-wide bottlenecks with active session history. From there, identify the exact queries causing the load and, finally, dive deep into individual query metrics. This isn't just data; it's a direct path from "What's wrong?" to "It's fixed."
postgres_ai dashboards
The design of these dashboards wasn't created in isolation. This work started many years ago and included extensive community collaboration:
- Community sessions organized by Nik Samokhvalov in 2020-2021 reviewing existing monitoring systems for Postgres, gathering insights from DBAs and SREs worldwide
- Comprehensive research that resulted in our monitoring checklist — defining what should be included in a complete Postgres monitoring solution
- Practical runbook for "dashboard #1" that defines what should be on the primary dashboard for "quick and shallow analysis" — a bird's eye view when you have just 1 minute to understand what areas potentially have issues
- Knowledge sharing through Nik's "Modern Postgres monitoring" tutorial at PGCon 2023 (slides available here)
These five dashboards represent years of refinement based on real-world usage and community feedback:
01. Troubleshooting dashboard
Following the Four Golden Signals approach, this dashboard provides immediate visibility into:
- Latency: Response times and query duration patterns
- Traffic: Transaction rates and connection activity
- Errors: Failed transactions, rollbacks, and error rates
- Saturation: Resource queuing, lock waits, and capacity limits
The dashboard uses stacked graphs throughout, providing immediate visual feedback on total throughput and resource consumption patterns.
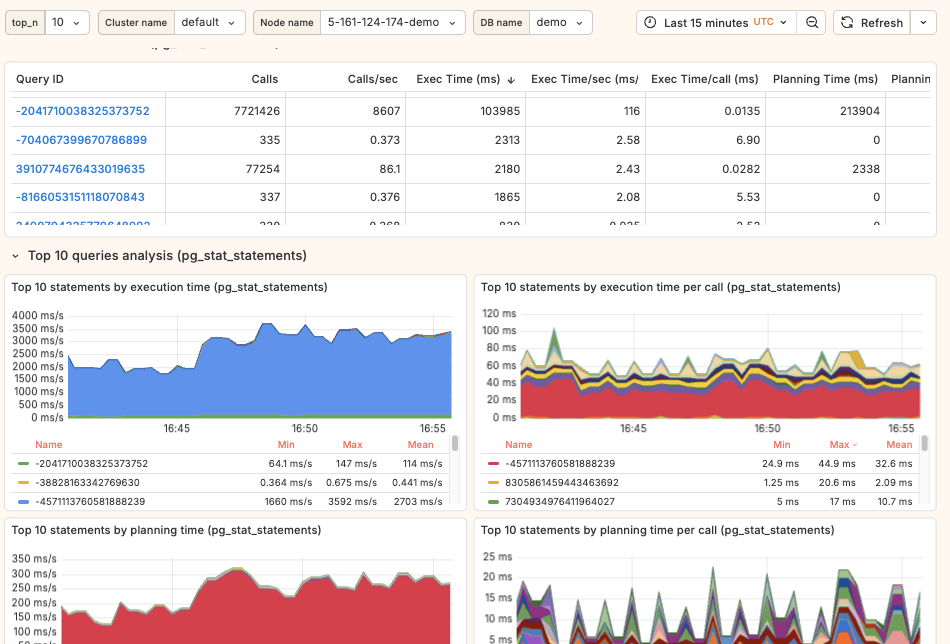
02. Query performance analysis (Top-N)
Comprehensive query workload analysis featuring:
- Resource consumption by query pattern (normalized
queryid) - Multiple metric views with per-second and per-call differentiation
- CPU*, I/O, and timing breakdowns
- Clickable queryids for instant deep dives
*Note: "CPU" represents wait_event IS NULL in pg_stat_activity—meaning either actual CPU usage or waiting on an event not yet instrumented in PostgreSQL source code.
03. Single query ID analysis
When you identify a problematic query, this dashboard provides everything Postgres can tell you about it:
- Complete
pg_stat_statementsmetrics (methodology details: part 1, part 2, part 3) - Historical performance trends
- Plan variations and their impacts
- Resource consumption patterns over time
04. Wait event analysis (Active Session History)
PostgreSQL's answer to Oracle ASH and AWS RDS Performance Insights:
- Real-time session activity sampling
- Wait event distribution over time
- Session-level troubleshooting
- Historical playback for incident analysis
This dashboard answers critical questions like "What were my databases waiting for during the 2 PM slowdown?"
05. Backups and DR
Currently focused on WAL archiving monitoring:
- WAL archive lag in bytes: Direct RPO (Recovery Point Objective) measurement
- Archive throughput and success rates
- Failure tracking and alerting
- Storage capacity planning
Future releases will expand this to cover full backup monitoring.
These five dashboards represent just the beginning of our planned roadmap. We have extensive plans for additional specialized dashboards covering areas like autovacuum analysis, checkpointer performance, detailed lock analysis, connection pooling metrics, and many other critical aspects of Postgres operations. Each new dashboard will follow the same research-driven approach, ensuring they provide maximum value for expert-level troubleshooting.
Technical architecture
From TimescaleDB to Prometheus
While pgwatch2 postgres.ai edition used PostgreSQL/TimescaleDB for metrics storage (and we loved it), we've switched to Prometheus for v0.7. This decision was driven by:
- Easier integration with existing monitoring stacks in large enterprises
- Better compatibility with cloud-native environments
- Standardized query language (PromQL) familiar to SRE teams
The dual storage solution
Prometheus has one limitation for query analysis: storing full query texts is inefficient and hits cardinality limits. Our solution uses:
- Prometheus: All metrics and time-series data
- PostgreSQL: Query text storage and metadata
This hybrid approach gives us the best of both worlds—efficient metrics storage with complete query visibility.
Key features for expert analysis
Comprehensive metrics table
Our query analysis includes a detailed table view showing:
- All
pg_stat_statementsmetrics - Per-second rates (such as
calls/s,rows/s, and, our favorite,s/s– "how many seconds is Postgres spending per second to do something specific?") - Per-call averages (
time/call,rows/call) - Direct
queryidlinking to single query analysis
All columns are orderable to support different "Top-N" vectors of analysis.
Compared to traditional charts, table view lacks historical data, but it brings compact view with detailed analysis of many various metrics for each queryid. Based on our experience, having both tables and charts provides complementary perspectives:
Visual design principles
We've switched from traditional line graphs to stacked area charts throughout the solution. This provides:
- Immediate visual feedback on total resource consumption
- Better understanding of workload composition
- Clearer identification of dominant consumers
Rapid navigation
Every queryid is clickable (in tables, charts, and popup tooltips) enabling instant pivots from overview to deep dive analysis.
Who should use this
postgres_ai v0.7 is open source (Apache 2.0 license); it is designed for:
- Senior DBAs managing critical Postgres deployments
- SRE teams responsible for database reliability
- Performance engineers conducting deep analysis
- AI systems requiring structured performance data
This is NOT a beginner-friendly tool. It assumes deep PostgreSQL knowledge and experience with performance troubleshooting.
What's coming next
We're actively developing:
- Full backup monitoring beyond WAL archiving
- Query plan analysis and recommendations
- Automated anomaly detection
- Enhanced AI integration capabilities
Getting started
postgres_ai v0.7 is available at https://gitlab.com/postgres-ai/postgres_ai
The solution is built using industry-standard components:
- pgwatch v3 (developed by Pavlo Golub from Cybertec) as the metrics collection framework
- Prometheus for time-series storage (everything but query texts)
- PostgreSQL for query text storage
- Grafana for visualization
What's next
We're preparing detailed case studies from our enterprise deployments. These will showcase real-world usage patterns and the value of expert-level monitoring in production environments.
While postgres_ai monitoring is already comprehensive, it lacks many components and we have a big roadmap we're going to iterate on. Among features we plan to implement in the nearest future:
- Host stats for both on-prem and managed Postgres setups
pg_wait_samplingandpg_stat_kcachesupport (these extensions are great! In our opinion, every Postgres platform needs them)- More dashboards with deep dives into various areas: autovacuum, checkpointer, lock analysis, and so on.
This monitoring tool is a gateway to comprehensive analysis that can be performed by Postgres experts with help from AI.
Try it out and let us know what you think!
- Live demo: demo.postgres.ai (
demo/demo) - Installation: quick start steps
postgres_ai is developed by Postgres AI, bringing years of PostgreSQL expertise into automated monitoring and analysis tools.