#PostgresMarathon 2-007: Should we worry about pg_blocking_pids()'s observer effect?

#PostgresMarathon 2-007: Should we worry about pg_blocking_pids()'s observer effect?
Many years ago, when developing complex automated procedures for a large company, I realized that my automation needs monitoring components. Including understanding heavyweight lock contention – for example, to recognize situations when a poorly designed change is blocked by things like autovacuum running in transaction ID wraparound prevention mode (it doesn't yield to anybody, when in this mode).
This led me to pg_blocking_pids() and analysis described in "Useful queries to analyze PostgreSQL lock trees (a.k.a. lock queues)".
Unfortunately, there is a catch – as the docs for pg_blocking_pids() describe:
Frequent calls to this function could have some impact on database performance, because it needs exclusive access to the lock manager's shared state for a short time.
But how bad is it?
First, let's study the code (I use PG18 sources here), it starts here. The comment to the function itself doesn't reveal extra secrets compared to the docs (though it has an interesting consideration for parallel-query cases, which is touched on in the docs too), so let's go deeper, function GetBlockerStatusData(), its comment has some words about potential observer effect:
 * The design goal is to hold the LWLocks for as short a time as possible;
 * thus, this function simply makes a copy of the necessary data and releases
 * the locks, allowing the caller to contemplate and format the data for as
 * long as it pleases.
And inside, we see this:
		/*
		 * Acquire lock on the entire shared lock data structure.  See notes
		 * in GetLockStatusData().
		 */
		for (i = 0; i < NUM_LOCK_PARTITIONS; i++)
			LWLockAcquire(LockHashPartitionLockByIndex(i), LW_SHARED);
So, it acquires ALL 16 partition locks (NUM_LOCK_PARTITIONS = 16, we discussed it before), using LW_SHARED. Potentially blocking attempts coming from backends to acquire an exclusive LWLock or a few (if multiple partitions need to be locked).
As promised, these locks are quickly released – a few lines below we see it (notice considerations about the order – interesting design decision to release them going backwards!):
	/*
	 * And release locks.  We do this in reverse order for two reasons: (1)
	 * Anyone else who needs more than one of the locks will be trying to lock
	 * them in increasing order; we don't want to release the other process
	 * until it can get all the locks it needs. (2) This avoids O(N^2)
	 * behavior inside LWLockRelease.
	 */
	for (i = NUM_LOCK_PARTITIONS; --i >= 0;)
		LWLockRelease(LockHashPartitionLockByIndex(i));
During this brief period of time if some backend attempts to acquire an exclusive LWLock (LW_EXCLUSIVE) to one or a few of 16 partitions of the main lock table, it will be briefly waiting for us, and it will be sitting with wait event LWLock:LockManager.
What kinds of workload can suffer from this the most? Well, those that acquire exclusive LW_EXCLUSIVE frequently – for example, those that already experience LWLock:LockManager contention, and our actions can "make things worse".
Another aspect here: if we have many rows to analyze in pg_stat_activity and pg_locks, there is a good chance that we'll be calling pg_blocking_pids() multiple times during a single call of our monitoring query. This is how SQL works: if we put pg_blocking_pids() to the SELECT clause of our query, it's going to be executed for each row in the result set.
I like the idea pganalyze has here – running the function only for rows that have wait event 'Lock':
select pid, pg_blocking_pids(pid)
from pg_stat_activity
where wait_event_type = 'Lock';
They also allow disabling lock analysis completely, recognizing the risks of pg_blocking_pids()'s observer effect.
Let's do a simple benchmark. Adding a hundred of extra indexes to pgbench_accounts (as we did before) and running --select-only workload, we'll make backends work with the main lock table a lot, causing LWLock:LockManager contention already. Then we'll be running the "monitoring" function in a loop, calling pg_blocking_pids() ~10 times per second for each backend analyzed.
I'm going to run it on my macbook m1 this time – partially because I'm curious to see LWLock:LockManager contention on a smaller machine. Last time we checked 16 vCPUs (Intel), this time it will be 8 (ARM).
pgbench initialized with -s10, and we'll be calling it twice, 10 minutes each, first without the "monitoring" part, and then with it. Here is pgbench call:
pgbench -r -n -T600 -P10 --select-only -j8 -c8 -U postgres postgres
The "monitoring" part:
do $$
declare
  start_time timestamptz := clock_timestamp();
begin
  while clock_timestamp() - start_time < interval '600 seconds' loop
    perform pg_blocking_pids(pid) from pg_stat_activity;
    pg_sleep(0.01);  -- 10ms = 100 calls/second
  end loop
end $$;
I used Cursor to run Postgres 18 in container, with all settings default (doesn't matter here), so max_locks_per_transaction is default, 64. Having 101 indexes is enough to cause contention.
Using new Browser feature I also asked Cursor to install postgres_ai monitoring – it was fun to see how it looks at the browser, troubleshooting various issues but successfully having monitoring for our experiment.
And here is the result:
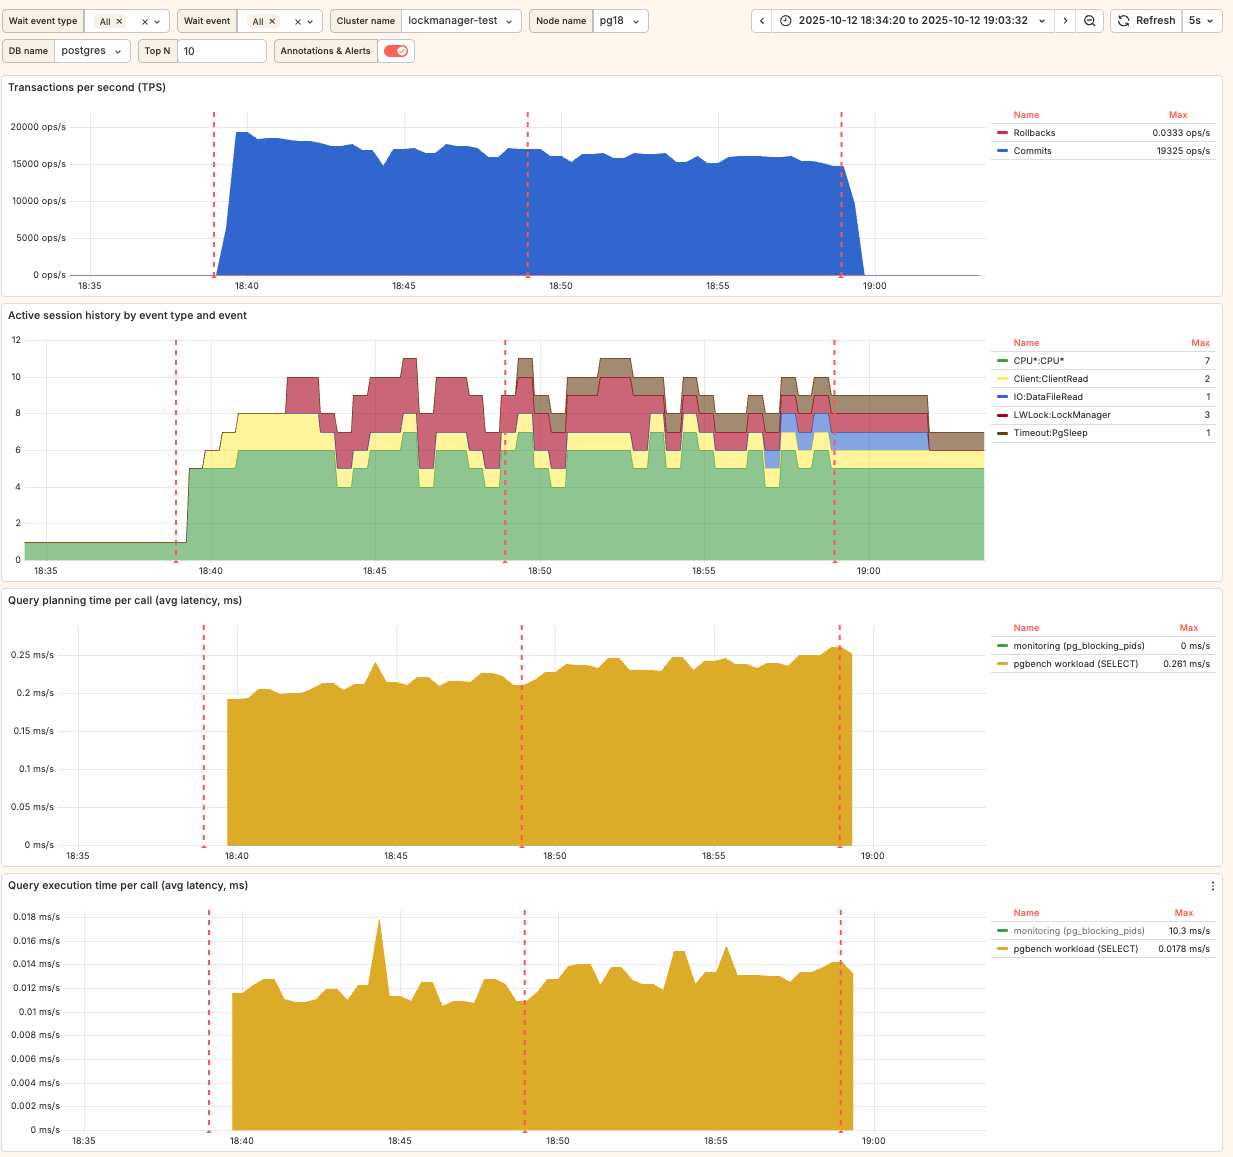
Comparing main SELECT's latencies from the pgbench output:
-
phase 1 (without monitoring query):
0.459 0 SELECT abalance FROM pgbench_accounts WHERE aid = :aid; -
phase 2 (with background
pg_blocking_pids()):0.505 0 SELECT abalance FROM pgbench_accounts WHERE aid = :aid; -
First of all, we do have
LWLock:LockManagercontention on this smaller machine (notice the red area on the second graph). It confirms the idea that we all should be aware of this problem. Though in this particular experiment it wasn't huge – 8 competing backends is quite low. -
When we started calling
pg_blocking_pids(), it only moderately affected the latency of the main workload's SELECT, increasing it from 0.459 ms to 0.505 ms – ~10% (accordingly, TPS dropped from 17,394 to 15,812).
Noticeable change, yet not significant. Of course, it can be more significant on a larger server, with hundreds of active sessions observed during performance issues.
Still, I would pay this "price" for having good lock analysis with history. What about you?