Progress bar for Postgres queries – let's dive deeper

Recently, I have read a nice post titled "Query Progress Bar", by Brian Davis. It describes an interesting approach to observing the progress of slow query execution.
At some point, the author mentions:
Don't use this in prod.
And I agree. The article discusses long-running queries such as SELECTs, UPDATEs, DELETEs, and quite "invasive" methods of progress monitoring. In an OLTP production scenario, in most cases, we should try to limit the duration of such queries, setting statement_timeout to a very low value – such as 30 or even 15 seconds.
Let's dive deeper into the topic of query progress monitoring, and discuss various types of queries, how to monitor their progress, considering production and non-production environments separately.
Progress monitoring for UPDATE/DELETE/INSERT
Production: split into batches and monitor the overall progress
Why are long-running queries bad for production with OLTP-like cases (web and mobile apps with many users)? Here are the reasons:
- Stress caused by intensive writes. Bulk change executed on a server with not the strongest disk subsystem, especially if the checkpointer is not tuned (first of all, max_wal_size – we'll talk about it soon, in a separate post), it may put your system down.
- Two more reasons related to DELETEs and UPDATEs:
- locking issues causing performance degradation, and
- the inability of autovacuum to cleanup dead tuples until the very end of long-running modifying query – this can put your server down too.
The common solution is to split the work into relatively small batches. It is not reasonable to choose a tiny batch size (say, dozens of rows) – because each transaction has its overhead. At the same time, if you use too large batches, there is a risk of locking and autovacuum-related issues again. I usually recommend choosing the batch size, so a single query always takes less than 1 second
In the article "What is a slow SQL query?", I explain how the performance of user request processing is related to human perceptual abilities. In most cases from my practice, 1 second turned out to be a reasonable limit for batched modifying queries – although, in some cases, it made sense to reduce this threshold even further. Allowing duration values longer than 1 second was never a good idea in OLTP-like cases because of the increased risks of noticeable performance issues, resulting in user complaints.
Now, back to the "progress bar" idea. How could we implement it for, say, DELETEs split into batches?
Let's take the example from Brian's post – the table big, slightly adjusting the numbers:
drop table if exists big;
create table big (
  other_val int
);

insert into big
select gs % 1000 + 1
from generate_series(1, 5000000) as gs;

create index on big (other_val);

vacuum analyze big;
In this case, it is reasonable to consider batches defined by the value of other_val – 1000 batches, each having 50000 rows. Again, for real-life OLTP-like workloads, I recommend using small enough batches to fit the deletion timing into 1 second.
Deleting rows in batches:
select set_config('adm.big_last_deleted_val', null, false) as reset;

with find_scope as (
  select other_val
  from big
  where
    other_val >= 1 + coalesce(
      nullif(current_setting('adm.big_last_deleted_val', true), '')
      , '0'
    )::int
  order by other_val
  limit 1
), del as (
  delete from big
  where other_val = (select other_val from find_scope)
  returning ctid, other_val
), get_max_val as (
  select max(other_val) as max_val
  from big
), result as (
  select
    set_config(
      'adm.big_last_deleted_val',
      max(other_val)::text, false
    ) as current_val,
    (select max_val from get_max_val) as max_val,
    count(*) rows_deleted,
    1 / count(*) as stop_when_done,
    min(ctid) as min_ctid,
    max(ctid) as max_ctid,
    round(max(other_val)::numeric
      / (select max_val from get_max_val)::numeric, 2) as progress
  from del
)
select
  *,
  format(
    '%s%s %s%%',
    repeat('▉', round(progress * 50)::int),
    repeat('░', greatest(0, 50 - round(progress * 50)::int)),
    round(progress * 100)
  ) as progress_vis
from result
\watch .5
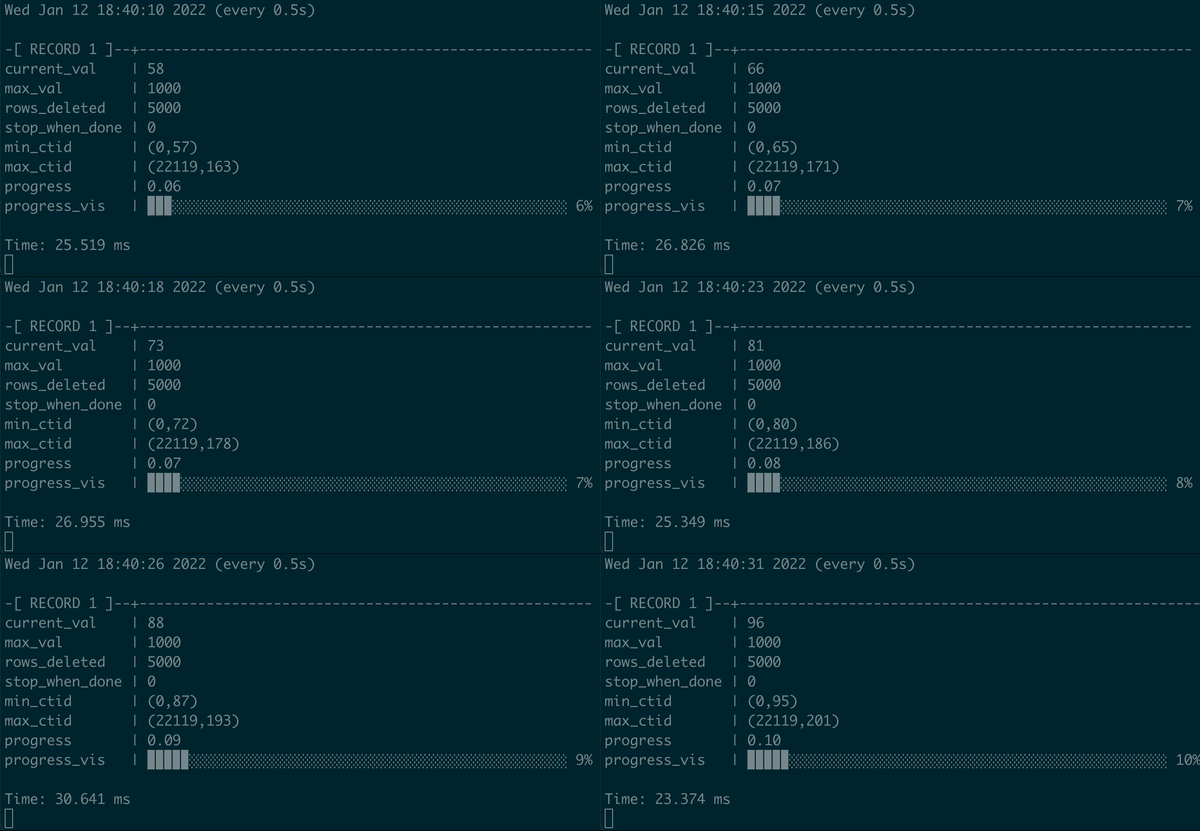
Animated demonstration:

Not only do we have some progress bar here, but we can show it with percentage and visualization that signals the user when the process will end. Real progress bar, yay!
Little tricks that you may find helpful in your scripting adventures:
- In the very end, I have used
\watch .5instead of a semicolon. This is for psql (Postgres default console client, which is not less awesome than Postgres server itself). The delay value, 500 ms in this example, should be chosen based on a particular case, considering the server's capabilities, autovacuum tuning, etc. - Configuration setting functions
set_config(..)andcurrent_setting(..)were used to pass the context from the previous iteration. This is optional – note that I used>=in thefind_scopeto find the minimal value ofother_valpresent in the table, so we would find our target rows to delete anyway. However, if the autovacuum is lagging, not cleaning up recently deleted rows quickly enough, without this trick, we will see how the performance of further iterations degrades over time. This happens when Postgres starts scanning entries in the index that point to dead tuples. But remembering the context helps our query be optimal even if many dead tuples are accumulated. You can deeply analyze it usingEXPLAIN (ANALYZE, BUFFERS)applied to not only the first iteration but to, say, the 1000th one (and remember to pay attention to buffers, as I explained in my previous post). - The expression
coalesce(nullif(current_setting('adm.big_last_deleted_val', true), ''), '0')::intlooks quite heavy, but this is a short way to say "give me a value from user-defined GUC (configuration parameters in Postgres)adm.big_last_deleted_val, and if it's empty/undefined, use 0". - Returning and showing system columns
ctidis some "extra", but I usually find it useful – when we need to perform massive operations in batches, this information (which presents the physical page ID and offset inside the page) can tell us how sparsely stored the deleted rows are, in some cases, suggesting some different approach to process the rows. In our example, we do see that rows deleted in each batch are very scattered – however, there is not much we can do about it since we have only a single column and single index in the table, not offering some other ways to process the rows. - The expression
1 / count(*) as stop_when_doneis somewhat a dirty hack – it is for cases when we run SQL of this kind in a psql session (probably launched insidescreenortmuxon a reliable server closer to the Postgres server, to avoid interruptions in case of connectivity issues). Once there are no rows that have been just deleted, we'll get adivision by zeroerror, and\watchcommand will be interrupted. It makes sense to implement iterations using some existing mechanism in your project – usually involving existing languages, frameworks, libraries, logging, and monitoring capabilities that are already in use. - More about division by zero. In the expression
round(max(other_val)::numeric / (select max_val from get_max_val)::numeric, 2) as progressthis error is not possible – whenget_max_valwon't find any rows, the value ofmax_valis going to be effectivelyNULL, and division byNULLgivesNULL. However, if we used some other approach to determine the "progress", the denominator value here could be0. In such a case, I recommend wrapping it intonullif(.., 0)– so0will be replaced byNULL, and we'll avoid "division by zero" when it's not needed. - Finally, visualization is straightforward – it is done using
format(for better readability, I prefer it over simple concatenation with||), andrepeat(..)functions.
Non-production, self-managed: pg_query_state
pg_query_state is an interesting extension from PostgresPro that allows observing execution plans in action.
It is quite exotic, so you will not find it on AWS RDS or other major managed Postgres cloud services. Nevertheless, if you manage Postgres yourself, you may find it very helpful for non-production environments. Keep in mind that it is still not a "clean" extension – it requires the Postgres core to be patched. But it is worth considering installing it in a "lab" environment.
Of course, pg_query_state can help monitor the "live" query execution plan not only for modifying queries (UPDATEs/DELETEs/INSERTs), but also for SELECTs. It can be used for any query that EXPLAIN supports – it does not mean that DML is fully supported and DDL is not. For example, EXPLAIN cannot be used for COPY or TRUNCATE but works with CREATE TABLE .. AS .. or CREATE MATERIALIZED VIEW AS ... (As for the COPY command, Postgres 14 introduced useful pg_stat_progress_copy.)
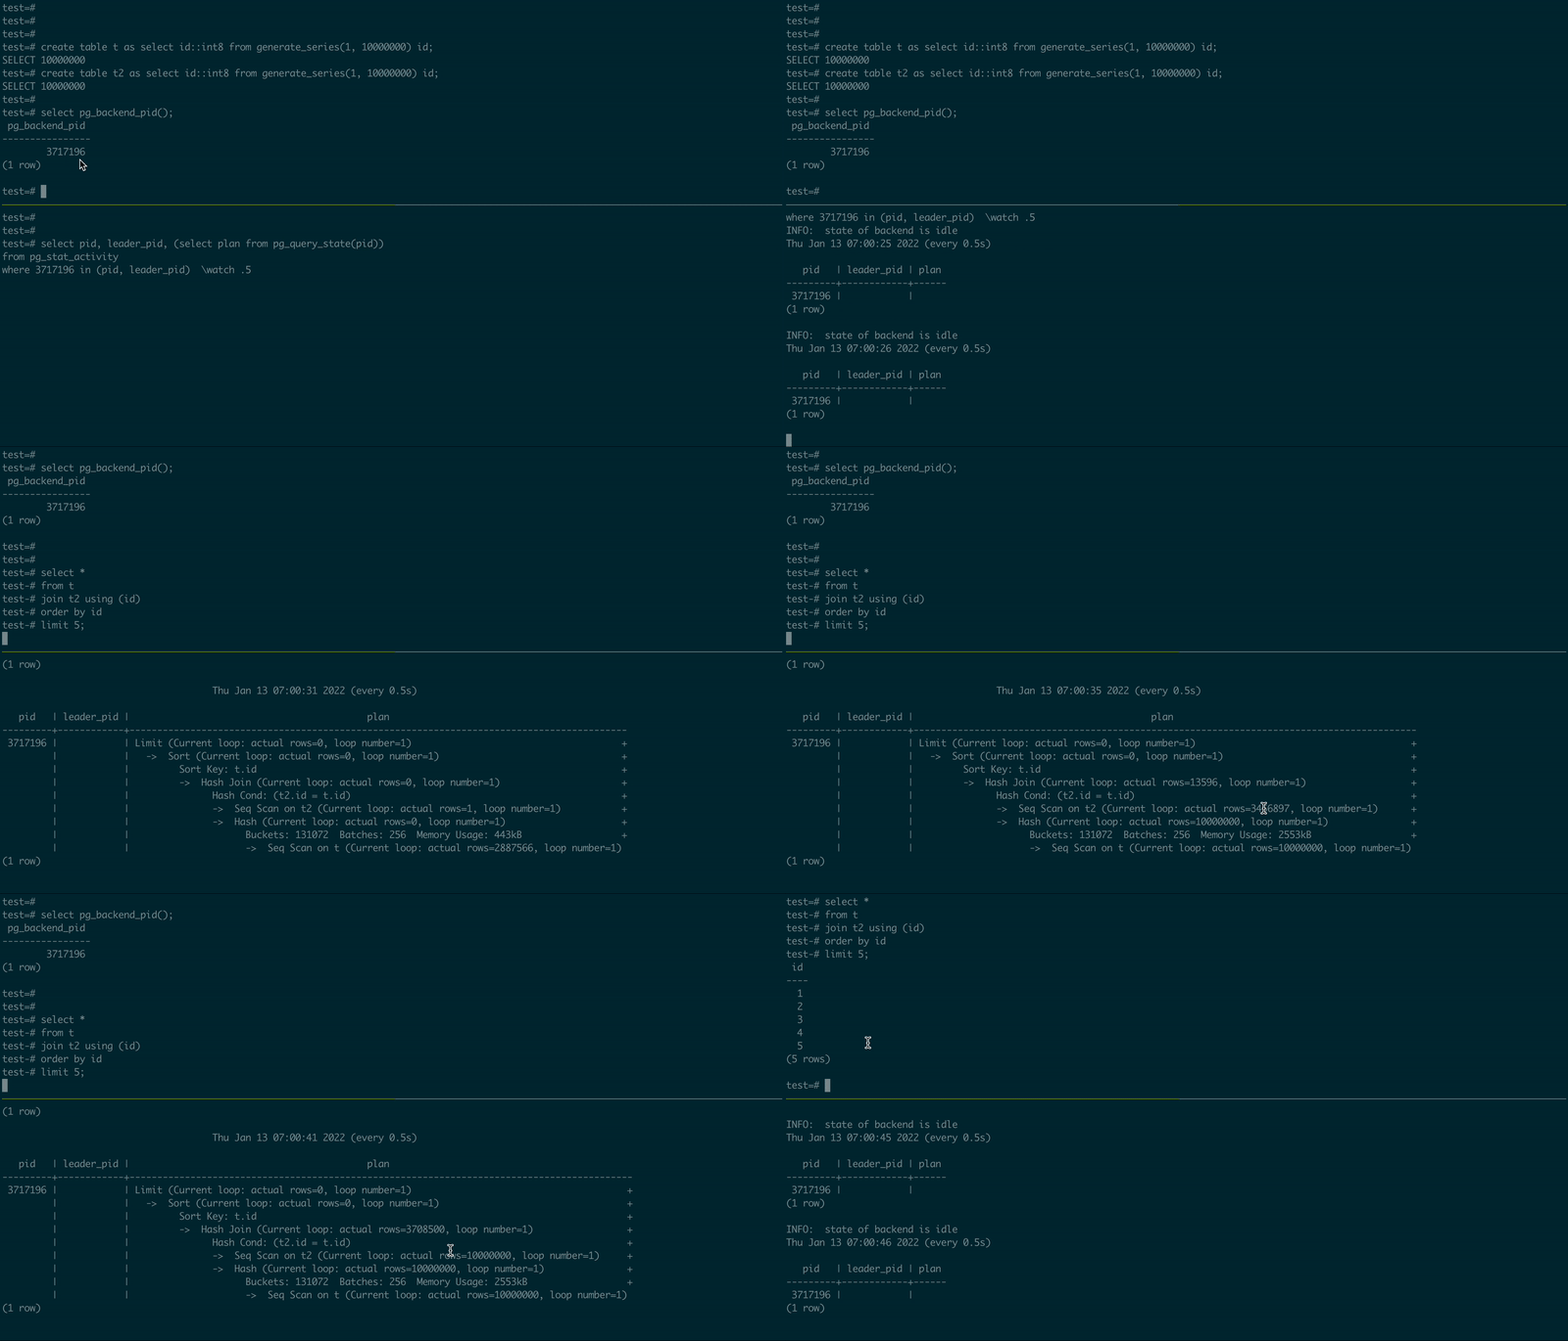
To demonstrate how it works, I used PostgreSQL 14.1 compiled (and patched) from the source code, created two tables, and then used two psql sessions, in one executing a simple JOIN, and another – observing the execution plan:
-- 1st psql session
create table t as select id::int8 from generate_series(1, 10000000) id;
create table t2 as select id::int8 from generate_series(1, 10000000) id;
select pg_backend_pid();

select *
from t
join t2 using (id)
order by id
limit 5;

-- 2nd psql session, using the PID value from the first one
\set PID 123456

select pid, leader_pid, (select plan from pg_query_state(pid))
from pg_stat_activity
where :PID in (pid, leader_pid)
\watch .5
Here is how it looks:

UPDATE (2021-01-18) Have a look at another interesting project that is in its early stage: pg_plan_inspector, the author of "The Internals of PostgreSQL". It also has a real progress bar!
Progress monitoring for DDL queries
If you aim to change schema without downtime, DDL queries should be fast and last less than 1 second. Except those that are supposed to last quite long, not introducing long-lasting exclusive locks. Perhaps the most common cases for the latter are CREATE INDEX CONCURRENTLY and ALTER TABLE .. VALIDATE CONSTRAINT (for a constraint that was previously quickly created in with the NOT VALID flag).
Progress of [re]indexing
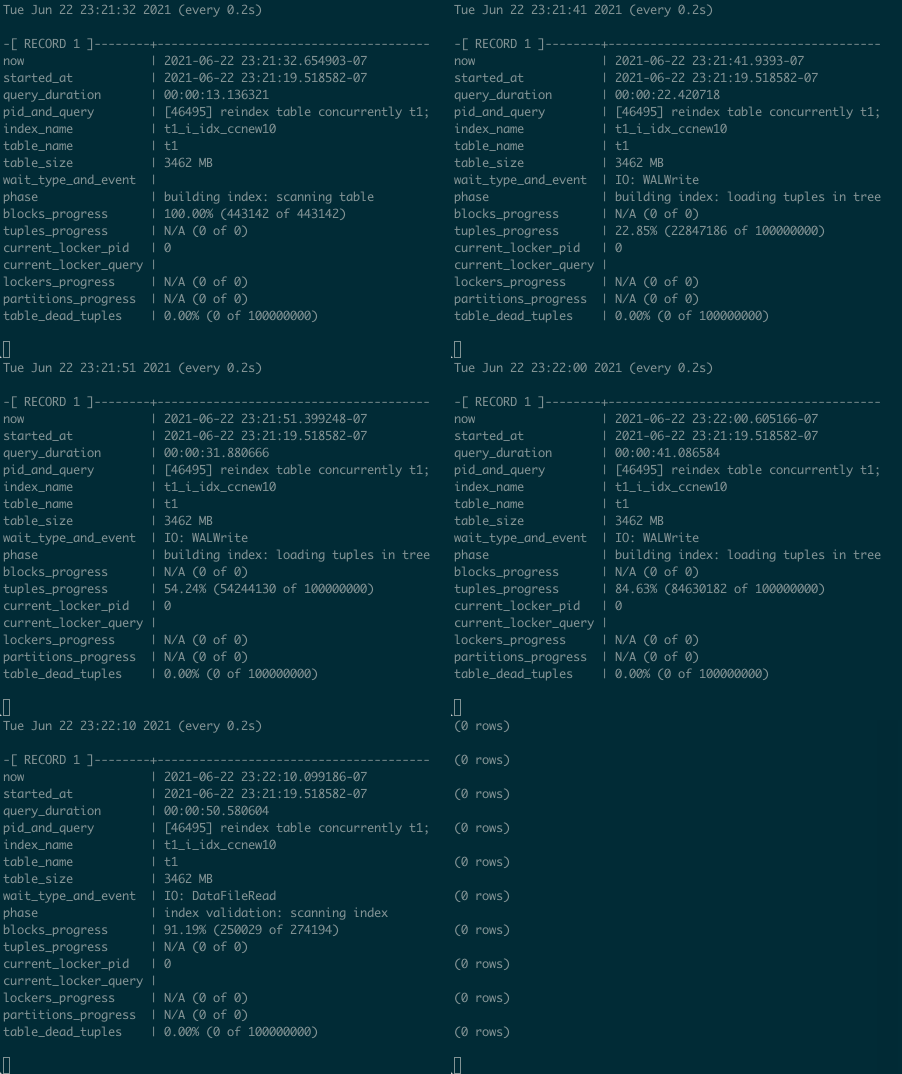
For index creation and recreation, there is pg_stat_progress_create_index, implemented in Postgres 12. Some time ago, I created a useful snippet to monitor the progress of index [re]creation:
select
  now(),
  query_start as started_at,
  now() - query_start as query_duration,
  format('[%s] %s', a.pid, a.query) as pid_and_query,
  index_relid::regclass as index_name,
  relid::regclass as table_name,
  (pg_size_pretty(pg_relation_size(relid))) as table_size,
  nullif(wait_event_type, '') || ': ' || wait_event as wait_type_and_event,
  phase,
  format(
    '%s (%s of %s)',
    coalesce((round(100 * blocks_done::numeric / nullif(blocks_total, 0), 2))::text || '%', 'N/A'),
    coalesce(blocks_done::text, '?'),
    coalesce(blocks_total::text, '?')
  ) as blocks_progress,
  format(
    '%s (%s of %s)',
    coalesce((round(100 * tuples_done::numeric / nullif(tuples_total, 0), 2))::text || '%', 'N/A'),
    coalesce(tuples_done::text, '?'),
    coalesce(tuples_total::text, '?')
  ) as tuples_progress,
  current_locker_pid,
  (select nullif(left(query, 150), '') || '...' from pg_stat_activity a where a.pid = current_locker_pid) as current_locker_query,
  format(
    '%s (%s of %s)',
    coalesce((round(100 * lockers_done::numeric / nullif(lockers_total, 0), 2))::text || '%', 'N/A'),
    coalesce(lockers_done::text, '?'),
    coalesce(lockers_total::text, '?')
  ) as lockers_progress,
  format(
    '%s (%s of %s)',
    coalesce((round(100 * partitions_done::numeric / nullif(partitions_total, 0), 2))::text || '%', 'N/A'),
    coalesce(partitions_done::text, '?'),
    coalesce(partitions_total::text, '?')
  ) as partitions_progress,
  (
    select
      format(
        '%s (%s of %s)',
        coalesce((round(100 * n_dead_tup::numeric / nullif(reltuples::numeric, 0), 2))::text || '%', 'N/A'),
        coalesce(n_dead_tup::text, '?'),
        coalesce(reltuples::int8::text, '?')
      )
    from pg_stat_all_tables t, pg_class tc
    where t.relid = p.relid and tc.oid = p.relid
  ) as table_dead_tuples
from pg_stat_progress_create_index p
left join pg_stat_activity a on a.pid = p.pid
order by p.index_relid
; -- in psql, use "\watch 5" instead of semicolon
Demo for REINDEX TABLE CONCURRENTLY:

Other long-running commands
You can read more about progress monitoring in "28.4. Progress Reporting" – there are useful views to monitor VACUUM, ANALYZE, CLUSTER. All these capabilities are great and are available on any Postgres installation, without special/exotic tools.
Unfortunately, there is no pg_stat_progress_*** view to monitor the progress of constraint validation. One idea to have some progress monitoring(for Linux machines): use PID(s) of backends (obtained using pg_backend_pid() and/or pid, leader_pid columns in pg_stat_activity) and then observe /proc/PID/io numbers to see how much bytes are read or written by certain processes.
Demonstration of this idea using a psql session running on the server with Postgres, and psql's \! command:
test=# select pg_backend_pid();
 pg_backend_pid
----------------
        135263
(1 row)

test=# \! while sleep 1; do cat /proc/135263/io | egrep ^write_bytes; done &
test=# create table huge as select id from generate_series(1, 100000000) id;
write_bytes: 2881523200
write_bytes: 3036499456
...
write_bytes: 16707886080
write_bytes: 16801512448
SELECT 100000000
test=# \! killall sleep
Terminated
test=#
test=#
test=# alter table huge add constraint c_h_1 check (id is not null) not valid;
ALTER TABLE
test=#
test=# \! while sleep 1; do cat /proc/135263/io | egrep ^read_bytes; done &
test=# alter table huge validate constraint c_h_1;
read_bytes: 3866767939
read_bytes: 4156198467
...
read_bytes: 7026241091
read_bytes: 7257476675
ALTER TABLE
test=# \! killall sleep
Terminated
test=# select
test-#   pg_size_pretty(16801512448 - 2881523200) as written_during_create,
test-#   pg_size_pretty(7257476675 - 3866767939) as read_during_validate;
 written_during_create | read_during_validate
-----------------------+----------------------
 13 GB                 | 3234 MB
(1 row)
Of course, this approach is available only for self-managed Postgres installations, where you have access to the filesystem.
Summary
Progress monitoring can be really useful and help avoid mistakes, especially when working with large databases under heavy load. Distinguishing production and non-production use, as well as SELECTs and INSERT and UPDATE/DELETE and DDL is important. In this article, I have provided a few recipes that, hopefully, will be useful to my readers—especially those who work with multi-terabyte databases and need to deal with billions of rows under load.

DBLab Engine
Instant database branching with O(1) economics.