AI-assisted Postgres experiment: number of partitions vs. planning time

In one of the recent PostgresFM episodes, Michael Christofides and Nikolay discussed planning time and what can affect it. One of the obvious negative factors we've discussed is the large number of partitions a partition table might have.
In this post, we're using our Postgres.AI assistant to see how planning time depends on the number of partitions.
This is the very first blog post of its kind: it has an integrated AI that you can use to explore the topic discussed here further, to repeat the experiment, alter it in any direction, and study the Postgres behavior more effectively.
If you, like some of us, prefer reading summaries, please jump straight to the AI chat section and ask for the "TL;DR" version. We don't mind.
Why
It's quite a well-known fact that with the growth in the number of partitions, planning time also grows. The official documentation says:
It is important to consider the overhead of partitioning during query planning and execution. The query planner is generally able to handle partition hierarchies with up to a few thousand partitions fairly well, provided that typical queries allow the query planner to prune all but a small number of partitions. Planning times become longer and memory consumption becomes higher when more partitions remain after the planner performs partition pruning.
There is a long thread in the pgsql-hackers mailing list where this problem is discussed, and where there are patches proposed to improve this overhead:
- [PoC] Reducing planning time when tables have many partitions (pgsql-hackers discussion),
- Reducing planning time when tables have many partitions (commitfest entry).
This work is still in progress (currently, patches need a next round of reviews). Meanwhile, fast-growing OLTP projects need to find a way to deal with multi-terabate tables, and partitioning is widely used. We thought it would be a good idea to conduct a simple database experiment to show how exactly the planning time depends on the number of partitions.
Experiment steps
The idea is straightforward: let's explore how the planning time grows when the number of partitions grows, in Postgres 16.
- Create a partitioned table, with PK:
create table partitioned_table (
    id int8 primary key,
    data text
) partition by range (id); - For a simple query, measure the planning time, buffer hits and reads used for planning (and do it 5 times):
explain (analyze, buffers) select * from partitioned_table where id = 1; - Then, using a loop in a
DOblock with PL/pgSQL, partitions were added to the table, with each partition containing 9,999 rows:do $do$
declare
i int;
begin
for i in 0..99 loop
execute format(
$sql$
create table partitioned_table_%s
partition of partitioned_table
for values from (%s) to (%s)
$sql$,
i,
i * 9999 + 1,
(i + 1) * 9999 + 1
);
execute format(
$sql$
insert into partitioned_table_%s
select generate_series(%s, %s) as id, 'data'
$sql$,
i,
i * 9999 + 1,
(i + 1) * 9999
);
execute format(
$sql$
create index on partitioned_table_%s (id)
$sql$,
i
);
end loop;
end $do$; - Run
vacuum analyzeon the partitioned table. - Repeat the
explain (analyze, buffers)as we did for 0 partitions. This time, looking at the plain returned by explain, ensure that partition pruning is working and we have Index Scan. - Double-check the current number of partitions, using
pg_inherits. - Iterate, repeating steps 3 to 6 – we need data points for 0, 100, 200, ..., 1000 partitions.
Let's do it (with AI)
We fed this detailed scenario to the Postgres AI system to start experimenting. The detailed communication can be found here: https://postgres.ai/chats/01924928-4727-78a4-a01a-c42e764f5466.
Once the instructions were received, the Postgres.AI assistant communicated with DBLab Engine to provide a database clone for Postgres 16 (empty, in this case; we can consider this as regular Postgres running in Docker), created the schema and started iterating, reporting intermediate results. After several minutes, we had all the numbers, and asked AI to visualize them:
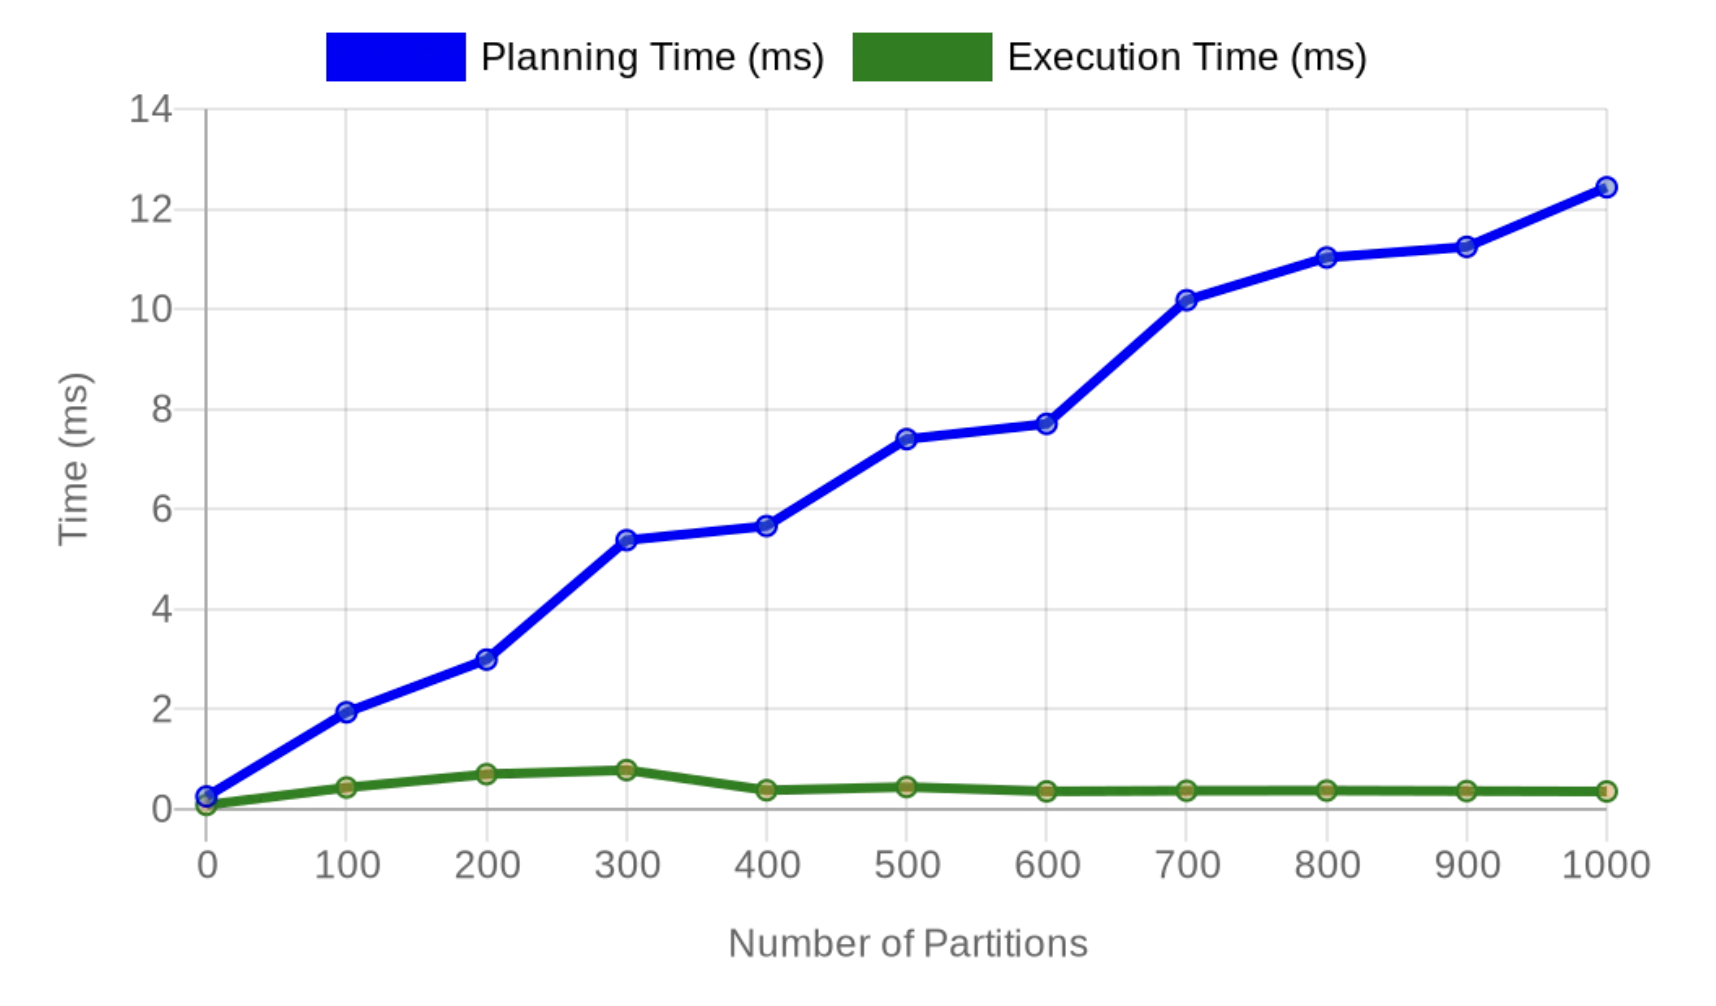
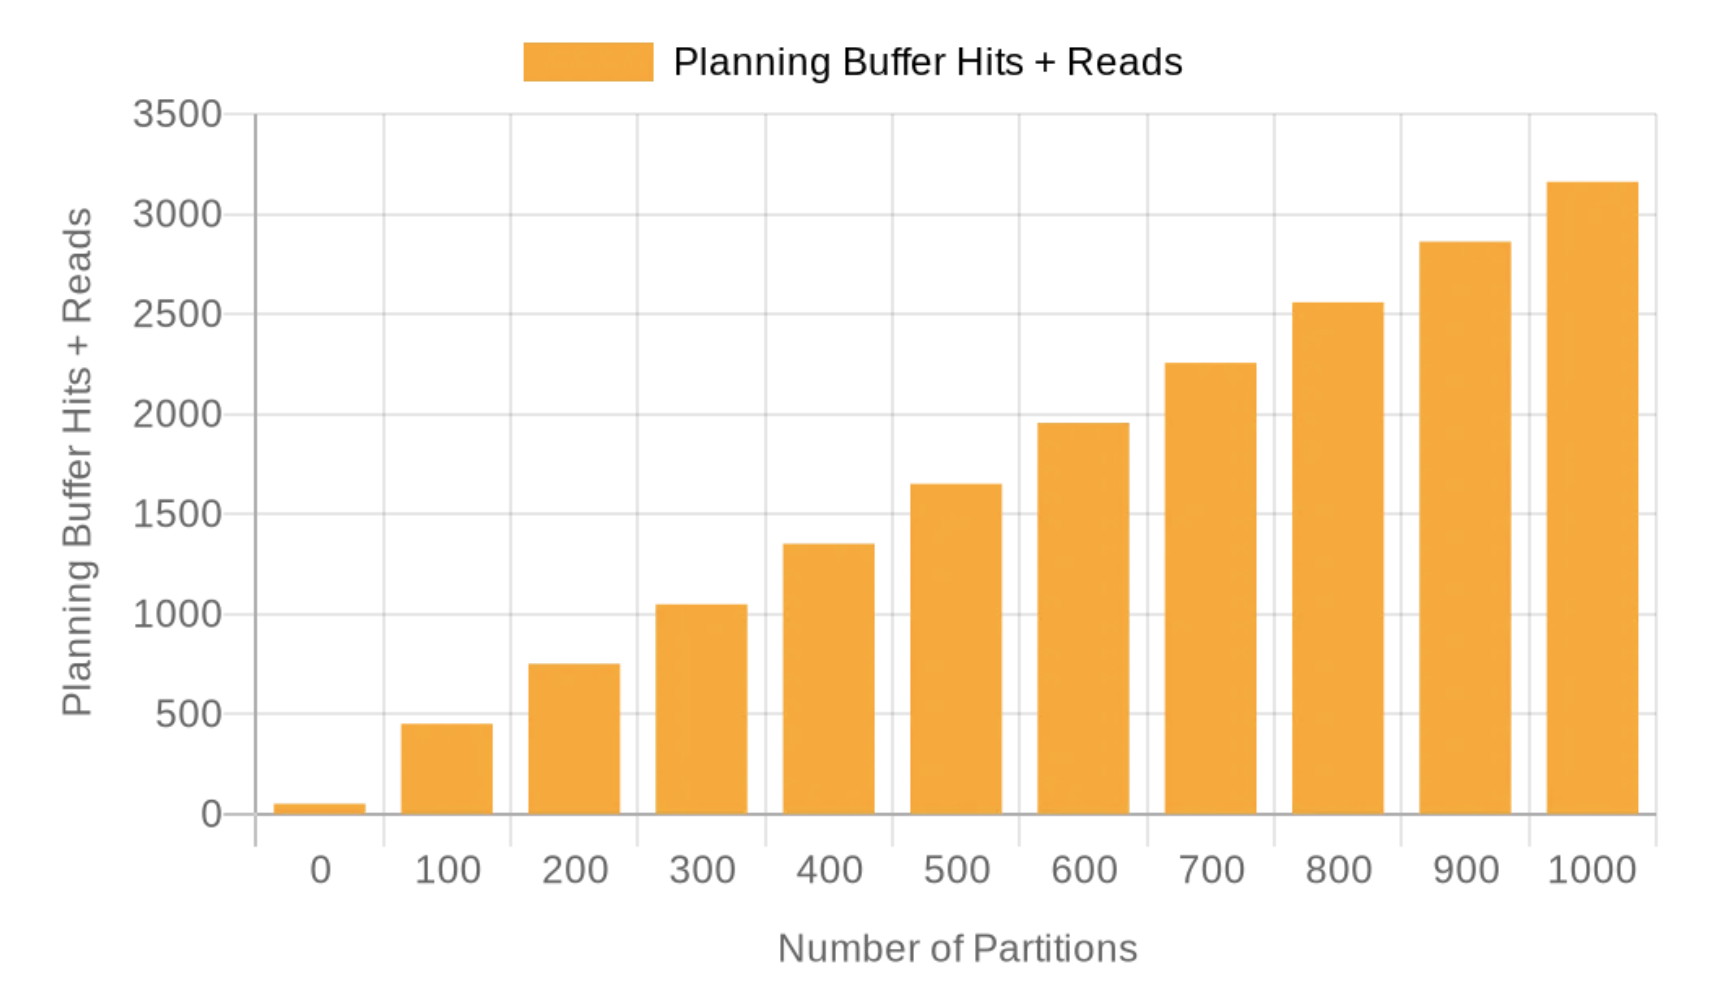
As we can see, the planning time grows linearly with the number of partitions, and in this environment, for this schema and query, a thousand partitions gives us 12+ ms for planning time. This is significant. On purpose, we used a primary key lookup query, to emphasize that the execution time remains very low, sub-millisecond (and it wouldn't change much with larger data sets, thanks to B-tree indexes). For 1,000 partitions, execution time was 0.354 ms, while planning time reached 12.435 – 35 times higher than execution time! And, as PostgresFM listeners know very well, we didn't forget to look at BUFFERS, which is also reported for the planning stage – we have linear growth here as well:
Is 10-12 ms a significant overhead? For OLTP – web, mobile, AI apps interacting with humans – the answer is definitely YES. As we discuss in "What is a slow SQL query?", in OLTP cases, in general, 10ms for SQL query execution (including the planning phase) should be considered "not fast". This is because human users typically notice delays exceeding 100-200ms, and one request from a user to the app usually leads to the execution of multiple SQL queries.
Explore it further
You can explore these results further and even modify the experiment using the Postgres.AI assistant below. Feel free to ask questions, suggest modifications, or dive deeper into specific aspects of the study.
For example, when we initially conducted this experiment, PostgreSQL 17 wasn't available. Now that it's released and supported by both DBLab Engine and the Postgres.AI assistant, you can use the tool above to compare results across different versions or explore how recent optimizations might affect planning time with partitioned tables.
Don't hesitate to experiment – your curiosity might uncover interesting insights or inspire further research!
Conclusions
It's pretty clear that the more partitions we have, the bigger the planning time.
Of course, this is a very trivial experiment, it's imperfect in many ways, defining potential future work:
- Statistical significance: each data point was measured only once, which is not statistically robust; for a more comprehensive analysis, multiple measurements should be taken for each number of partitions to account for variability.
- Connection overhead: current implementation of our AI system implies that every SQL is executed in a separate connection; the impact of fresh connections on system catalog caching wasn't considered here, but obviously some of those buffer hits for planning were related to the initial work with system catalogs performed for the very first planning event in a session.
- Planning buffer hits vs. planning time: while it's clear that both planning buffer hits and planning time were growing with the growth of the number of partitions, the relationship between those numbers needs further exploration. Additionally, we could explore more complex situations: for example, having many indexes might amplify the issue with growing planning time – because during planning, Postgres needs to lock all indexes and tables involved in planning, using
AccessShareLock. - Plan complexity: we explored only a trivial plan, searching for a single row by partition key. With more indexes defined on the table, and more sophisticated filtering, the overhead to the planning time might be even bigger, and different effects might be observed.
- Solution exploration: this post focused on demonstrating the issue rather than exploring solutions.
Speaking of solutions: if the number of partitions inevitably grows, one could consider using prepared statements to let Postgres cache plans, performing the planning operations much less often. However, in the case of partitioned tables, partition pruning, which usually happens during the planning phase, shifts to the execution phase if generic plan is used. This adds overhead to the execution phase, and in certain situations can lead to higher risks of LWLock:LockManager contention, an infamous performance cliff. Prepared statements might still be considered a valid solution in some cases, but their use requires thorough analysis. This topic of "partitioning + prepared statements" definitely deserves a separate discussion. For now, let's agree that the basic reliable "solution" to the problem is to keep the number of partitions low.
There is a good rule many people follow: if we have tables exceeding 100 GiB, they have to be partitioned. If we aim to keep individual partition size below 100 GiB and have no more than 1,000 partitions, this already means a capacity of 100 GiB * 1000 = ~100 TiB for a partitioned table, which looks quite "enough" for most practical OLTP cases in 2024 (this might easily change in, say, 5-10 years).
Based on all of the above, let's derive two principles to follow when partitioning large tables:
Prefer low number of partitions, stay below 1,000 or at least below 5-10k. If you need that many, monitor planning time e.g., holistically usingUPDATE: see the post extension below. While planning time still might be at risk with partition number growth, it's definitely not the case for trivial cases like one tested here. We recommend repeating the test with your own schema and workload.pg_stat_statements(note that by default, it haspg_stat_statements.track_planningdisabled – to track planning time, this needs to be enabled; it is worth studying potential overhead of it separately).- At the same time, keep individual partition sizes, say, below 100 GiB.
Update (2024-10-04): it's bad only for the first query in session
As mentioned above, in our original test a new connection was established for each query. After this article was published, David Rowley pointed out that the conclusions in it look misleading:
I just want to highlight that these results are misleading. Almost all of the additional overhead you're getting with more partitions is the repopulation of the partition descriptor in the relcache. This is because you're running 1 query before disposing of the backend.
— David Rowley (@davidrowley_pg) October 4, 2024
Indeed, most heavily-loaded systems use connection pooling, so only the very first query in a session behaves like was demonstrated here.
To explore the behavior of the second query, I entered into the Postgres.AI Assistant widget integrated to the post:
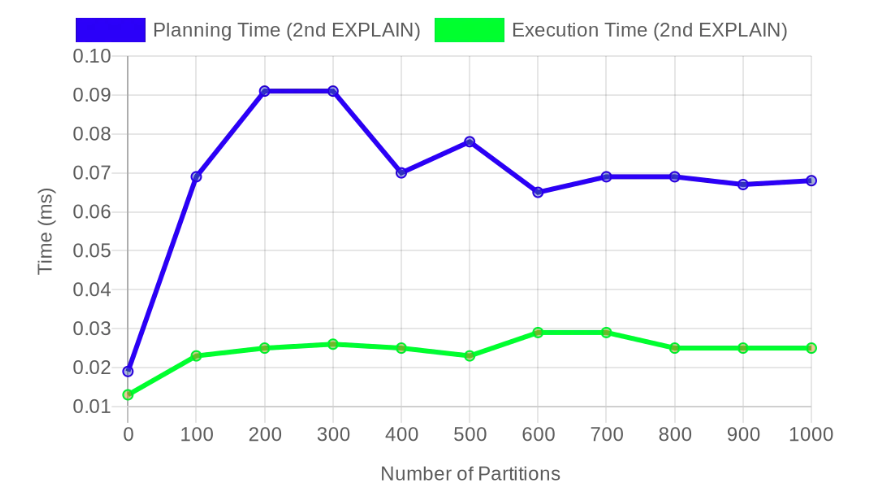
Let's repeat the experiment, but this time run double EXPLAIN in one call:
explain ...; explain ...;. And take metrics for both of them. We'll need to closely look at both of them separately because we suspect that the second EXPLAIN in each case is supposed to have much lower overhead both for planning time and planning buffer hits+reads, because the very first query in each session. Let's do only one iteration at a time: first only 0 and 100 partitions, then discuss and continue with 200 and so on. Clarify SQL you're going to use. Don't forget to test the case with 0 partitions. Also, keep in mind we needexplain ..; explain ...;in a single call!
Here is that session: https://postgres.ai/chats/01925880-7a47-794d-a075-ef32768a5f1d.
And as David pointed out, the overhead goes away, so the planning time stays below 0.1 ms even when we have 1,000 partitions!
And looking at the BUFFERS operations used for the planning, we see it's constant, as low as 3 hits (3 * 8 KiB = 24 KiB), regardless of the number of partitions for this simple case:
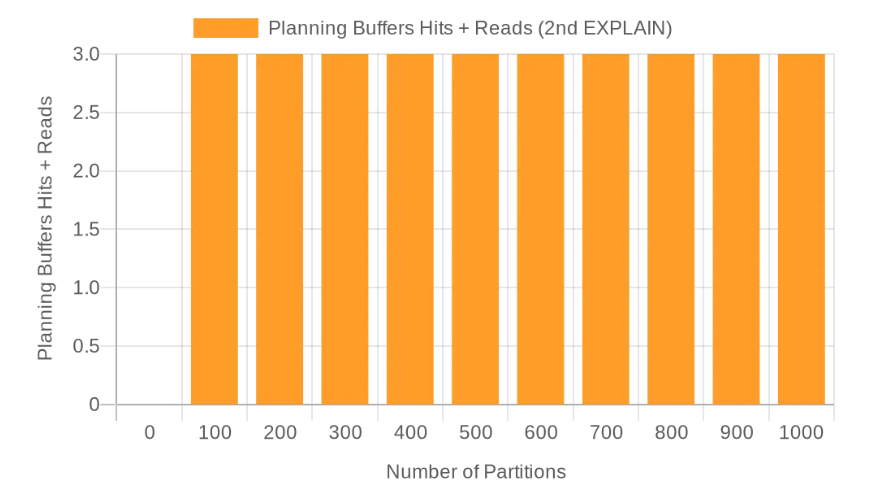
This observation emphasizes the importance of persisting connections, of the use of connection poolers.
We encourage you to experiment with the interactive AI assistant provided in this post, explore how these findings apply to your specific use cases, and share your experiences with the wider Postgres community.
Acknowledgments: We thank the people who participated in preparing the data for this blog post, reviewing it, iterating, and fixing: Vitaliy Kukharik, Dmitry Fomin, Bogdan Tsechoev, Tatiana Samokhvalova, Andrei Lepikhov, and Michael Christofides.