How moving one word can speed up a query 10–50x


One of these queries is 32x faster than the other. Which one, and why?
Query 1:
select pt.*
from post_tags pt
where pt.tag_id = any($1)
and exists (
    select
    from posts
    where posts.post_id = pt.post_id
      and not deleted
);
Query 2:
select pt.*
from post_tags pt
where pt.tag_id = any($1)
and not exists (
    select
    from posts
    where posts.post_id = pt.post_id
      and deleted
);
These two queries are logically equivalent here because posts.post_id is a primary key — the subquery matches at most one row, so AND NOT deleted vs. AND deleted simply flips a boolean. A foreign key on post_tags.post_id guarantees no orphans.
Read on to find out why the performance difference is so dramatic. This pattern was first spotted by Maxim Boguk on a 400 GiB production table, where the speedup was approximately 50x.
One SQL rewrite, 32x faster — no schema changes needed:
- NOT EXISTS with a partial index on the minority (deleted rows) beats EXISTS on the majority by 32x
- The winning query reads 29x fewer buffer reads — lower I/O, lower cloud bill
- Root cause: 'not found in index' skips the heap entirely; 'found' requires a heap fetch on any actively updated table
The setup
A classic soft-delete pattern: a posts table with a boolean deleted flag,
and a post_tags junction table linking posts to tags.
Most posts are active; 2% are soft-deleted.
Two partial indexes: one on active rows (posts_not_deleted_id_key, 1,050 MiB),
one on deleted rows (posts_deleted_id_key, 22 MiB).
Q1 hits the large index; Q2 hits the small one. Same result. Dramatically different cost — as the numbers below show.
Reproduce it
Full script, raw EXPLAIN (ANALYZE, BUFFERS) output, and configs:
https://gitlab.com/postgres-ai/postgresql-consulting/tests-and-benchmarks/-/issues/74
-- setup (~3-5 min for 50M rows on modern hardware)
create table posts (
    post_id  bigint primary key,
    deleted  boolean not null default false,
    content  text not null default repeat('x', 200)
) with (autovacuum_enabled = false);  -- benchmark only: keeps VM state deterministic; never disable autovacuum in production

insert into posts (post_id, deleted)
select g, (random() < 0.02)
from generate_series(1, 50000000) g;

create unique index posts_not_deleted_id_key on posts (post_id) where not deleted;
create unique index posts_deleted_id_key     on posts (post_id) where deleted;

create table post_tags (
    tag_id   int not null,
    post_id  bigint not null,
    primary key (tag_id, post_id)
) with (autovacuum_enabled = false);  -- benchmark only; never disable autovacuum in production

insert into post_tags (tag_id, post_id)
select (g % 1000) + 1, ceil(random() * 50000000)::bigint
from generate_series(1, 500000) g
on conflict do nothing;

-- step 1: fill visibility map cleanly
vacuum analyze posts;
vacuum analyze post_tags;

-- step 2: controlled dirty — simulate active production table
-- autovacuum_enabled=false ensures VM state stays dirty until benchmark
update posts
set content = repeat('y', 200)
where post_id % 10 = 0;
analyze posts;

-- verify: must be NULL
select relname, last_autovacuum
from pg_stat_user_tables
where relname = 'posts';

-- drop OS page cache + restart PG before each query
-- systemctl stop postgresql && echo 3 > /proc/sys/vm/drop_caches && systemctl start postgresql

-- run both queries with EXPLAIN (ANALYZE, BUFFERS)
-- compare: Execution Time, Heap Fetches, Buffers: shared read
Benchmark results
Environment: PostgreSQL 18 (beta), 8 dedicated cores, 32 GiB RAM, SSD storage,
shared_buffers=8GB, effective_cache_size=24GB, work_mem=64MB, random_page_cost=1.1 (appropriate for SSD), track_io_timing=on.
Cold OS page cache before each run (drop_caches + PG restart).
Dirty visibility map: vacuum analyze after load, then 10% of rows updated.
Full raw EXPLAIN (ANALYZE, BUFFERS) output:
https://gitlab.com/postgres-ai/postgresql-consulting/tests-and-benchmarks/-/issues/74

tag_ids Q1: EXISTS(NOT deleted) Q2: NOT EXISTS(deleted) speedup Q1 reads Q2 reads ratio
-------------- ------------------------- ------------------------- --------- ----------- ---------- ------
50 (~25k) 5,350 ms 384 ms 14x 50,900 4,132 12x
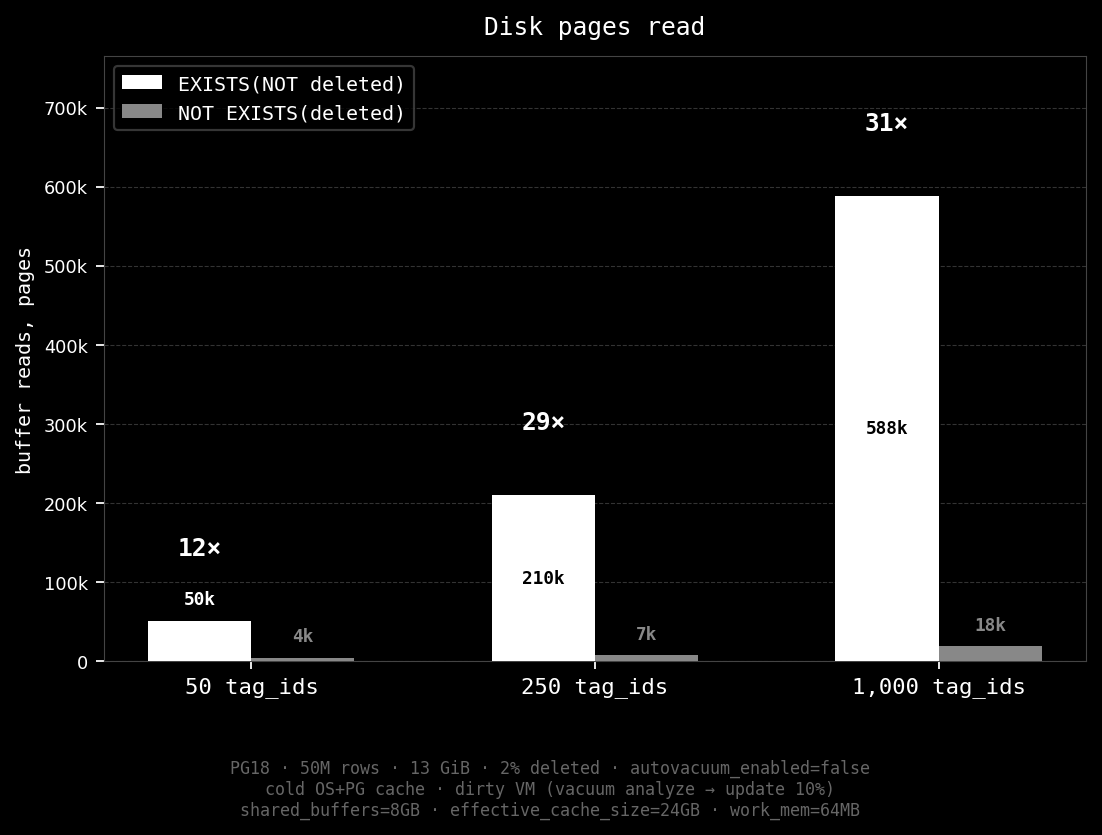
250 (~125k) 22,574 ms 717 ms 31x 211,017 7,296 29x
1000 (~500k) 63,750 ms 1,996 ms 32x 588,083 18,759 31x
500k post_tags rows across 1,000 tag_ids — ~500 rows per tag_id on average. Parenthetical counts are approximate result set sizes.
Both queries use Nested Loop throughout all scales.
EXPLAIN (ANALYZE, BUFFERS) at 250 tag_ids, cold cache:
Q1: EXISTS(NOT deleted) — 22,574 ms — key numbers: Heap Fetches: 132,280 · Buffers read: 209,207 (× 8 KiB = 1,634 MiB) — one heap fetch nearly every lookup, most of them cold reads
Gather  (cost=1077.65..12313.25 rows=4885 width=12) (actual time=130.759..22556.785 rows=122521.00 loops=1)
  Workers Planned: 1
  Workers Launched: 1
  Buffers: shared hit=542482 read=211017 dirtied=112214
  I/O Timings: shared read=40822.933
  InitPlan 1
    ->  ProjectSet  (cost=0.00..1.27 rows=250 width=4) (actual time=0.005..0.036 rows=250.00 loops=1)
          ->  Result  (cost=0.00..0.01 rows=1 width=0) (actual time=0.001..0.002 rows=1.00 loops=1)
  ->  Nested Loop  (cost=76.38..10823.48 rows=2874 width=12) (actual time=124.611..22276.230 rows=61260.50 loops=2)
        Buffers: shared hit=542482 read=211017 dirtied=112214
        I/O Timings: shared read=40822.933
        ->  Parallel Bitmap Heap Scan on post_tags pt  (cost=75.82..2739.08 rows=2928 width=12) (actual time=121.114..153.806 rows=62500.00 loops=2)
              Recheck Cond: (tag_id = ANY ((InitPlan 1).col1))
              Heap Blocks: exact=604
              Buffers: shared hit=20 read=1810
              I/O Timings: shared read=113.180
              ->  Bitmap Index Scan on post_tags_pkey  (cost=0.00..74.57 rows=4978 width=0) (actual time=124.449..124.449 rows=125000.00 loops=1)
                    Index Cond: (tag_id = ANY ((InitPlan 1).col1))
                    Buffers: shared read=635
                    I/O Timings: shared read=111.714
        ->  Index Only Scan using posts_not_deleted_id_key on posts  (cost=0.56..2.76 rows=1 width=8) (actual time=0.352..0.352 rows=0.98 loops=125000)
              Index Cond: (post_id = pt.post_id)
              Heap Fetches: 132280
              Buffers: shared hit=542462 read=209207 dirtied=102763
              I/O Timings: shared read=40709.753
Settings: effective_cache_size = '24GB', work_mem = '64MB', random_page_cost = '1.1'
Planning Time: 18.443 ms
Execution Time: 22573.605 ms
Q2: NOT EXISTS(deleted) — 717 ms — key numbers: Heap Fetches: 2,680 · Buffers read: 7,296 total — heap fetches only for the 2% that are actually deleted
Gather  (cost=1077.51..10437.12 rows=4885 width=12) (actual time=119.394..711.118 rows=122521.00 loops=1)
  Workers Planned: 1
  Workers Launched: 1
  Buffers: shared hit=374645 read=7296 dirtied=2109
  I/O Timings: shared read=976.376
  InitPlan 1
    ->  ProjectSet  (cost=0.00..1.27 rows=250 width=4) (actual time=0.009..0.034 rows=250.00 loops=1)
          ->  Result  (cost=0.00..0.01 rows=1 width=0) (actual time=0.001..0.001 rows=1.00 loops=1)
  ->  Nested Loop Anti Join  (cost=76.24..8947.35 rows=2874 width=12) (actual time=113.648..695.187 rows=61260.50 loops=2)
        Buffers: shared hit=374645 read=7296 dirtied=2109
        I/O Timings: shared read=976.376
        ->  Parallel Bitmap Heap Scan on post_tags pt  (cost=75.82..2739.08 rows=2928 width=12) (actual time=111.997..122.751 rows=62500.00 loops=2)
              Recheck Cond: (tag_id = ANY ((InitPlan 1).col1))
              Heap Blocks: exact=594
              Buffers: shared hit=20 read=1810
              I/O Timings: shared read=106.570
              ->  Bitmap Index Scan on post_tags_pkey  (cost=0.00..74.57 rows=4978 width=0) (actual time=115.628..115.628 rows=125000.00 loops=1)
                    Index Cond: (tag_id = ANY ((InitPlan 1).col1))
                    Buffers: shared read=635
                    I/O Timings: shared read=105.342
        ->  Index Only Scan using posts_deleted_id_key on posts  (cost=0.42..2.12 rows=1 width=8) (actual time=0.009..0.009 rows=0.02 loops=125000)
              Index Cond: (post_id = pt.post_id)
              Heap Fetches: 2680
              Buffers: shared hit=374625 read=5486 dirtied=1994
              I/O Timings: shared read=869.805
Settings: effective_cache_size = '24GB', work_mem = '64MB', random_page_cost = '1.1'
Planning Time: 16.347 ms
Execution Time: 717.256 ms
Why it's faster
Two factors stack on top of each other, both pointing the same direction.
Factor 1: "not found in index" skips the heap entirely
This is the dominant factor.
When Q2 looks up a post in posts_deleted_id_key and finds nothing —
it's done. "Not found" unconditionally skips the heap. No visibility check.
The visibility map doesn't matter at all.
The index scan itself is cheap — a few index page reads — but not the expensive random heap fetches that follow a "found" result.
(See: Index-Only Scans in the Postgres docs.)
When Q1 looks up a post in posts_not_deleted_id_key and finds a row —
"Found" skips the heap only if the page is all-visible in the visibility map
— a condition that breaks on any actively updated table.
If the page is not all-visible, Postgres must verify visibility with a heap fetch:
a random read into a 13 GiB table.
Heap fetches measured across all scales:
tag_ids        Q1: EXISTS(NOT deleted)   Q2: NOT EXISTS(deleted)
-------------- ------------------------- -----------------------
50  (~25k)     26,966 heap fetches       554
250 (~125k)    132,280 heap fetches      2,680
1000 (~500k)   526,344 heap fetches      10,766
Q1 heap-fetches nearly every active post in the result — up to 527k random reads into a table that doesn't fit in memory.
Q2 heap-fetches only the deleted posts. For 98% of lookups, it finds nothing in the small index and stops there. The small number of heap fetches Q2 does make (for the 2% that are actually deleted) is incidental — even if every deleted-row heap page were dirty, Q2 would still win by roughly 50x. The cardinality difference is the driver, not the visibility map state of the deleted pages.
One more cost visible in the EXPLAIN output: Q1 shows dirtied=112,214. Heap fetches that encounter tuples whose hint bits haven't been set yet write those bits back, marking the page dirty. Those 112k dirty pages must eventually be flushed by bgwriter or written at checkpoint. Q2 dirties 2,109. Under concurrent load, Q1 is not just slow for the session running it — it generates write pressure that affects everyone.
Why can't the planner avoid this? Both queries use Nested Loop with Index Only Scan — the right plan shape for a unique index lookup. The key asymmetry: an IOS that finds nothing has nothing to verify and stops at the index. An IOS that finds a tuple must still confirm visibility — and on any actively updated table, if the page isn't marked all-visible in the visibility map, that means a heap fetch. Q1 finds a match on 98% of probes; 10% of pages are dirty; heap fetches cascade. The planner picks the right plan shape; it just can't predict how many of those heap fetches will be cold.
The deeper issue: the planner has cardinality — pg_class.reltuples, pg_stat_user_tables.n_dead_tup, visibility map fraction — but no model for buffer pool state under concurrent load. "How many of these heap pages will be in shared_buffers at runtime?" is not something statistics can answer. There's no GUC to tune your way out of this. The query rewrite is the fix.
Factor 2: index size vs. available cache
index                      covers           size
-------------------------- ---------------- --------
posts_not_deleted_id_key   49M active rows  1,050 MiB
posts_deleted_id_key        1M deleted rows    22 MiB
posts_deleted_id_key is 22 MiB — fits in shared_buffers easily and stays warm.
posts_not_deleted_id_key is 1,050 MiB — nearly 50x larger. On a cold start it must be read from disk page by page during the nested loop. But cold cache is just the extreme case. The same penalty applies whenever the index doesn't fit in cache: memory-constrained servers, buffer pools competed for by other queries, or any index that exceeds the combined OS page cache and shared_buffers available to it.
The 22 MiB index stays warm under any realistic production load. The 1,050 MiB index gets evicted. When the index pages are cold, the heap fetch pages are almost certainly cold too — the two factors compound.
To confirm that heap fetches are the dominant factor and not just a cold-cache story: with both indexes and the heap fully warmed via pg_prewarm, Q1 drops to 724 ms and Q2 to 161 ms — still a 4.5x gap with zero I/O. Q1 still performed 122k heap fetches; Q2 performed 2,562. Q1 also re-read 55,690 blocks that had been evicted from shared_buffers during the scan itself — the 13 GiB heap can't stay resident when a nested loop scatters 122k accesses across 1.67M pages with only ~1M pages of buffer space. Increasing RAM reduces Factor 2 but cannot fully eliminate Factor 1. The rewrite matters regardless of how much memory you have.
The takeaway
"Not found in the index" skips the heap. "Found" requires a heap fetch on any actively updated table.
When 98% of your lookups are for the majority case (active posts), you want those lookups to return "not found" against the small index — not "found" against the large one.
Use
NOT EXISTSwith a partial index on the minority (deleted, disabled, flagged) — notEXISTSwith a partial index on the majority.
This applies to any boolean minority pattern: is_archived, is_banned, is_draft, is_suspended — anywhere a small fraction of rows carry a flag.