Quick start guide for Supabase users
Set up PostgresAI monitoring for your Supabase databases using the built-in Supabase integration in PostgresAI Console.
Overview
The Supabase integration uses OAuth to automatically discover your Supabase projects and provision monitoring — no manual database credentials or network configuration required.
Two monitoring levels are available:
| Level | Includes | Plan |
|---|---|---|
| Quick setup | Auto-discovery, daily checkups, JSON reports | Free |
| Full monitoring | Grafana dashboards, real-time metrics, advanced alerts, historical data | Scaling |
Prerequisites
- A Supabase account with at least one project.
- A PostgresAI Console account. Sign up with Google, LinkedIn, GitHub, or GitLab.
- An organization in PostgresAI Console. Create one if you don't have one yet.
- A payment method on file (required for the Scaling plan). In your organization, open Billing, click Edit payment methods, and add a card in the Stripe portal.
Step 1. Start the Supabase setup
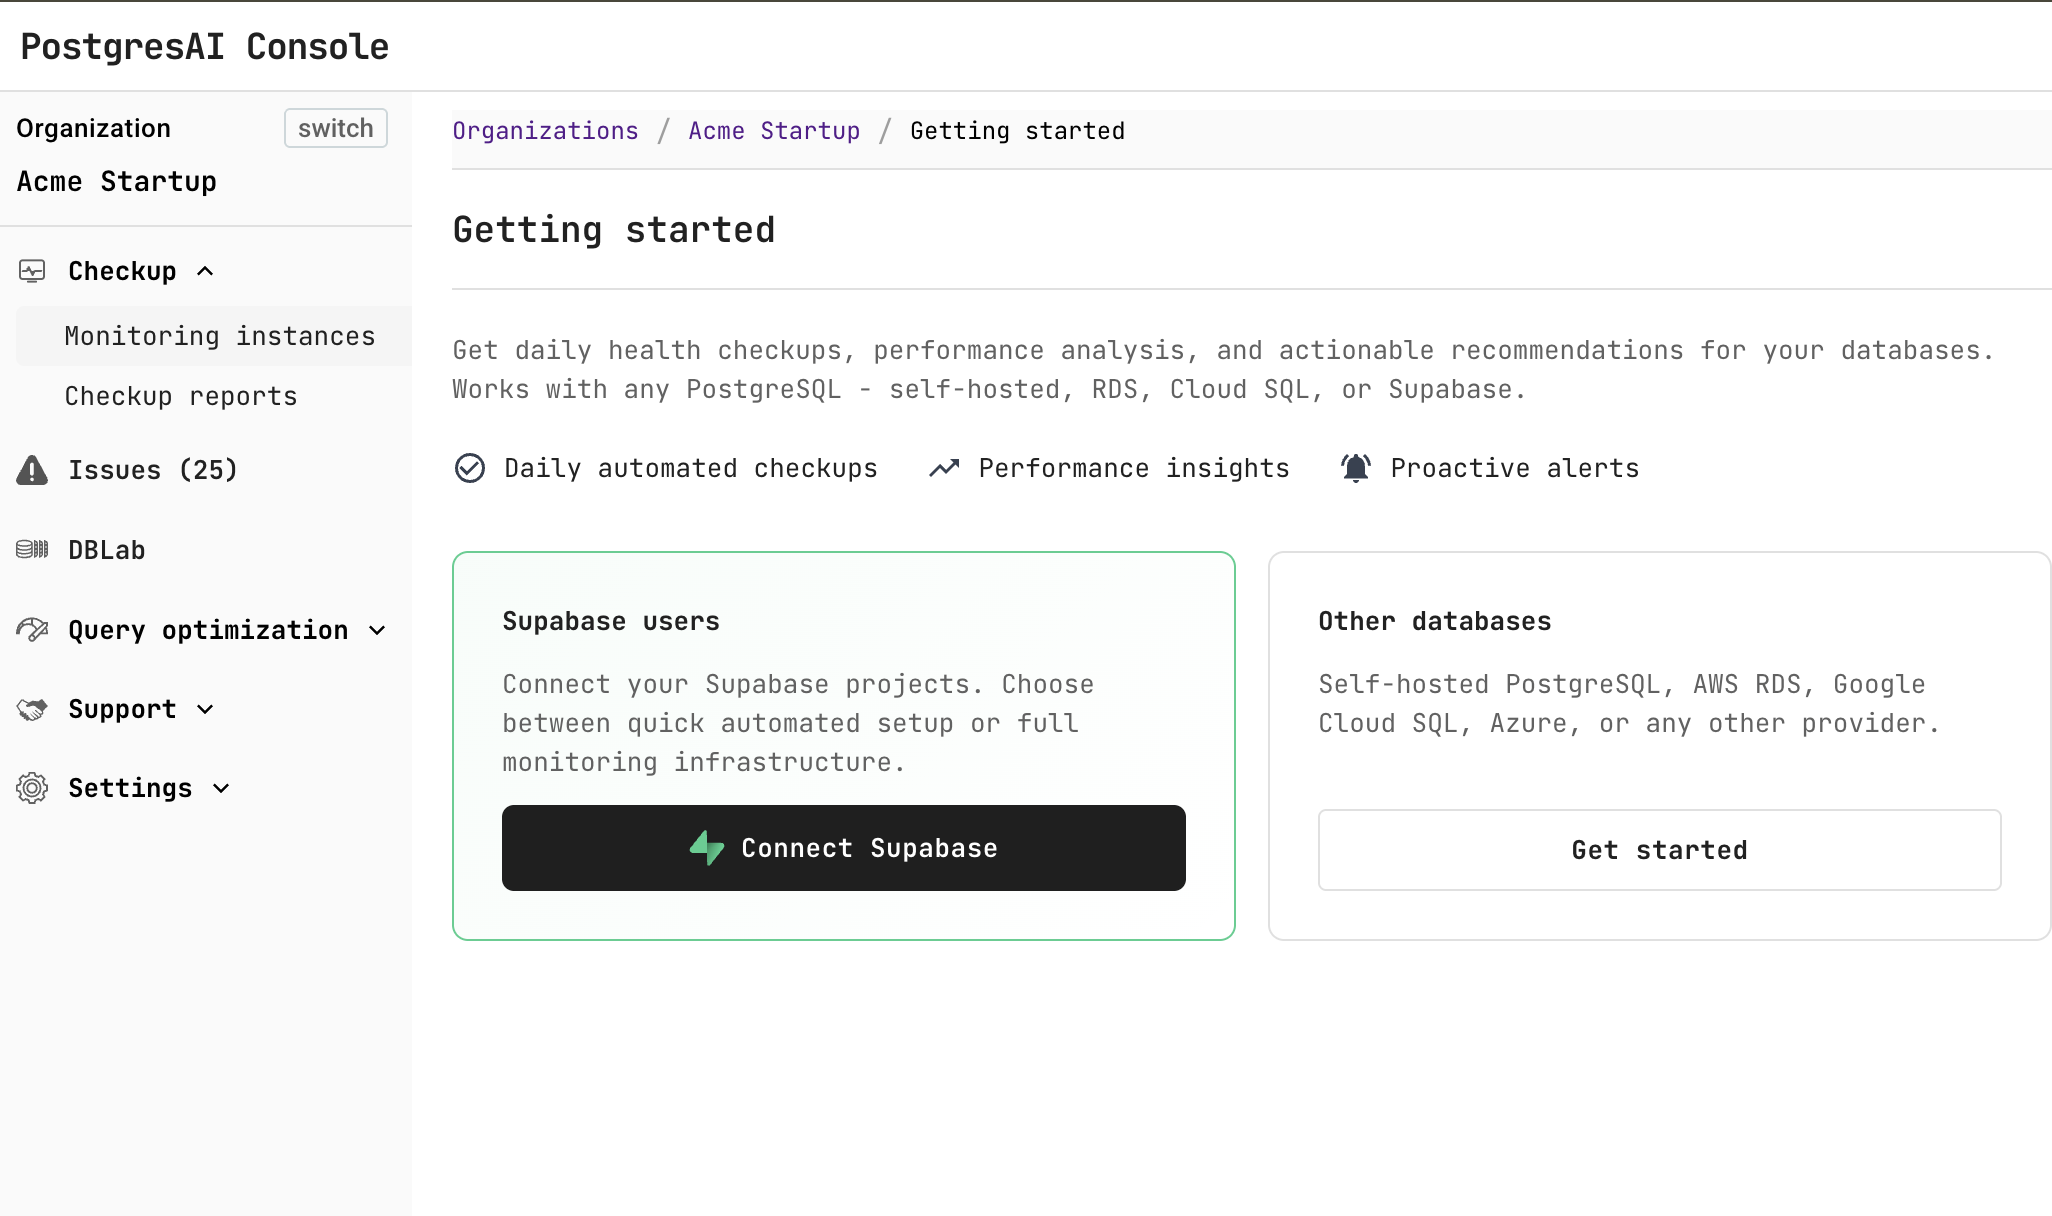
In PostgresAI Console, navigate to Checkup — Getting started and click Connect Supabase.
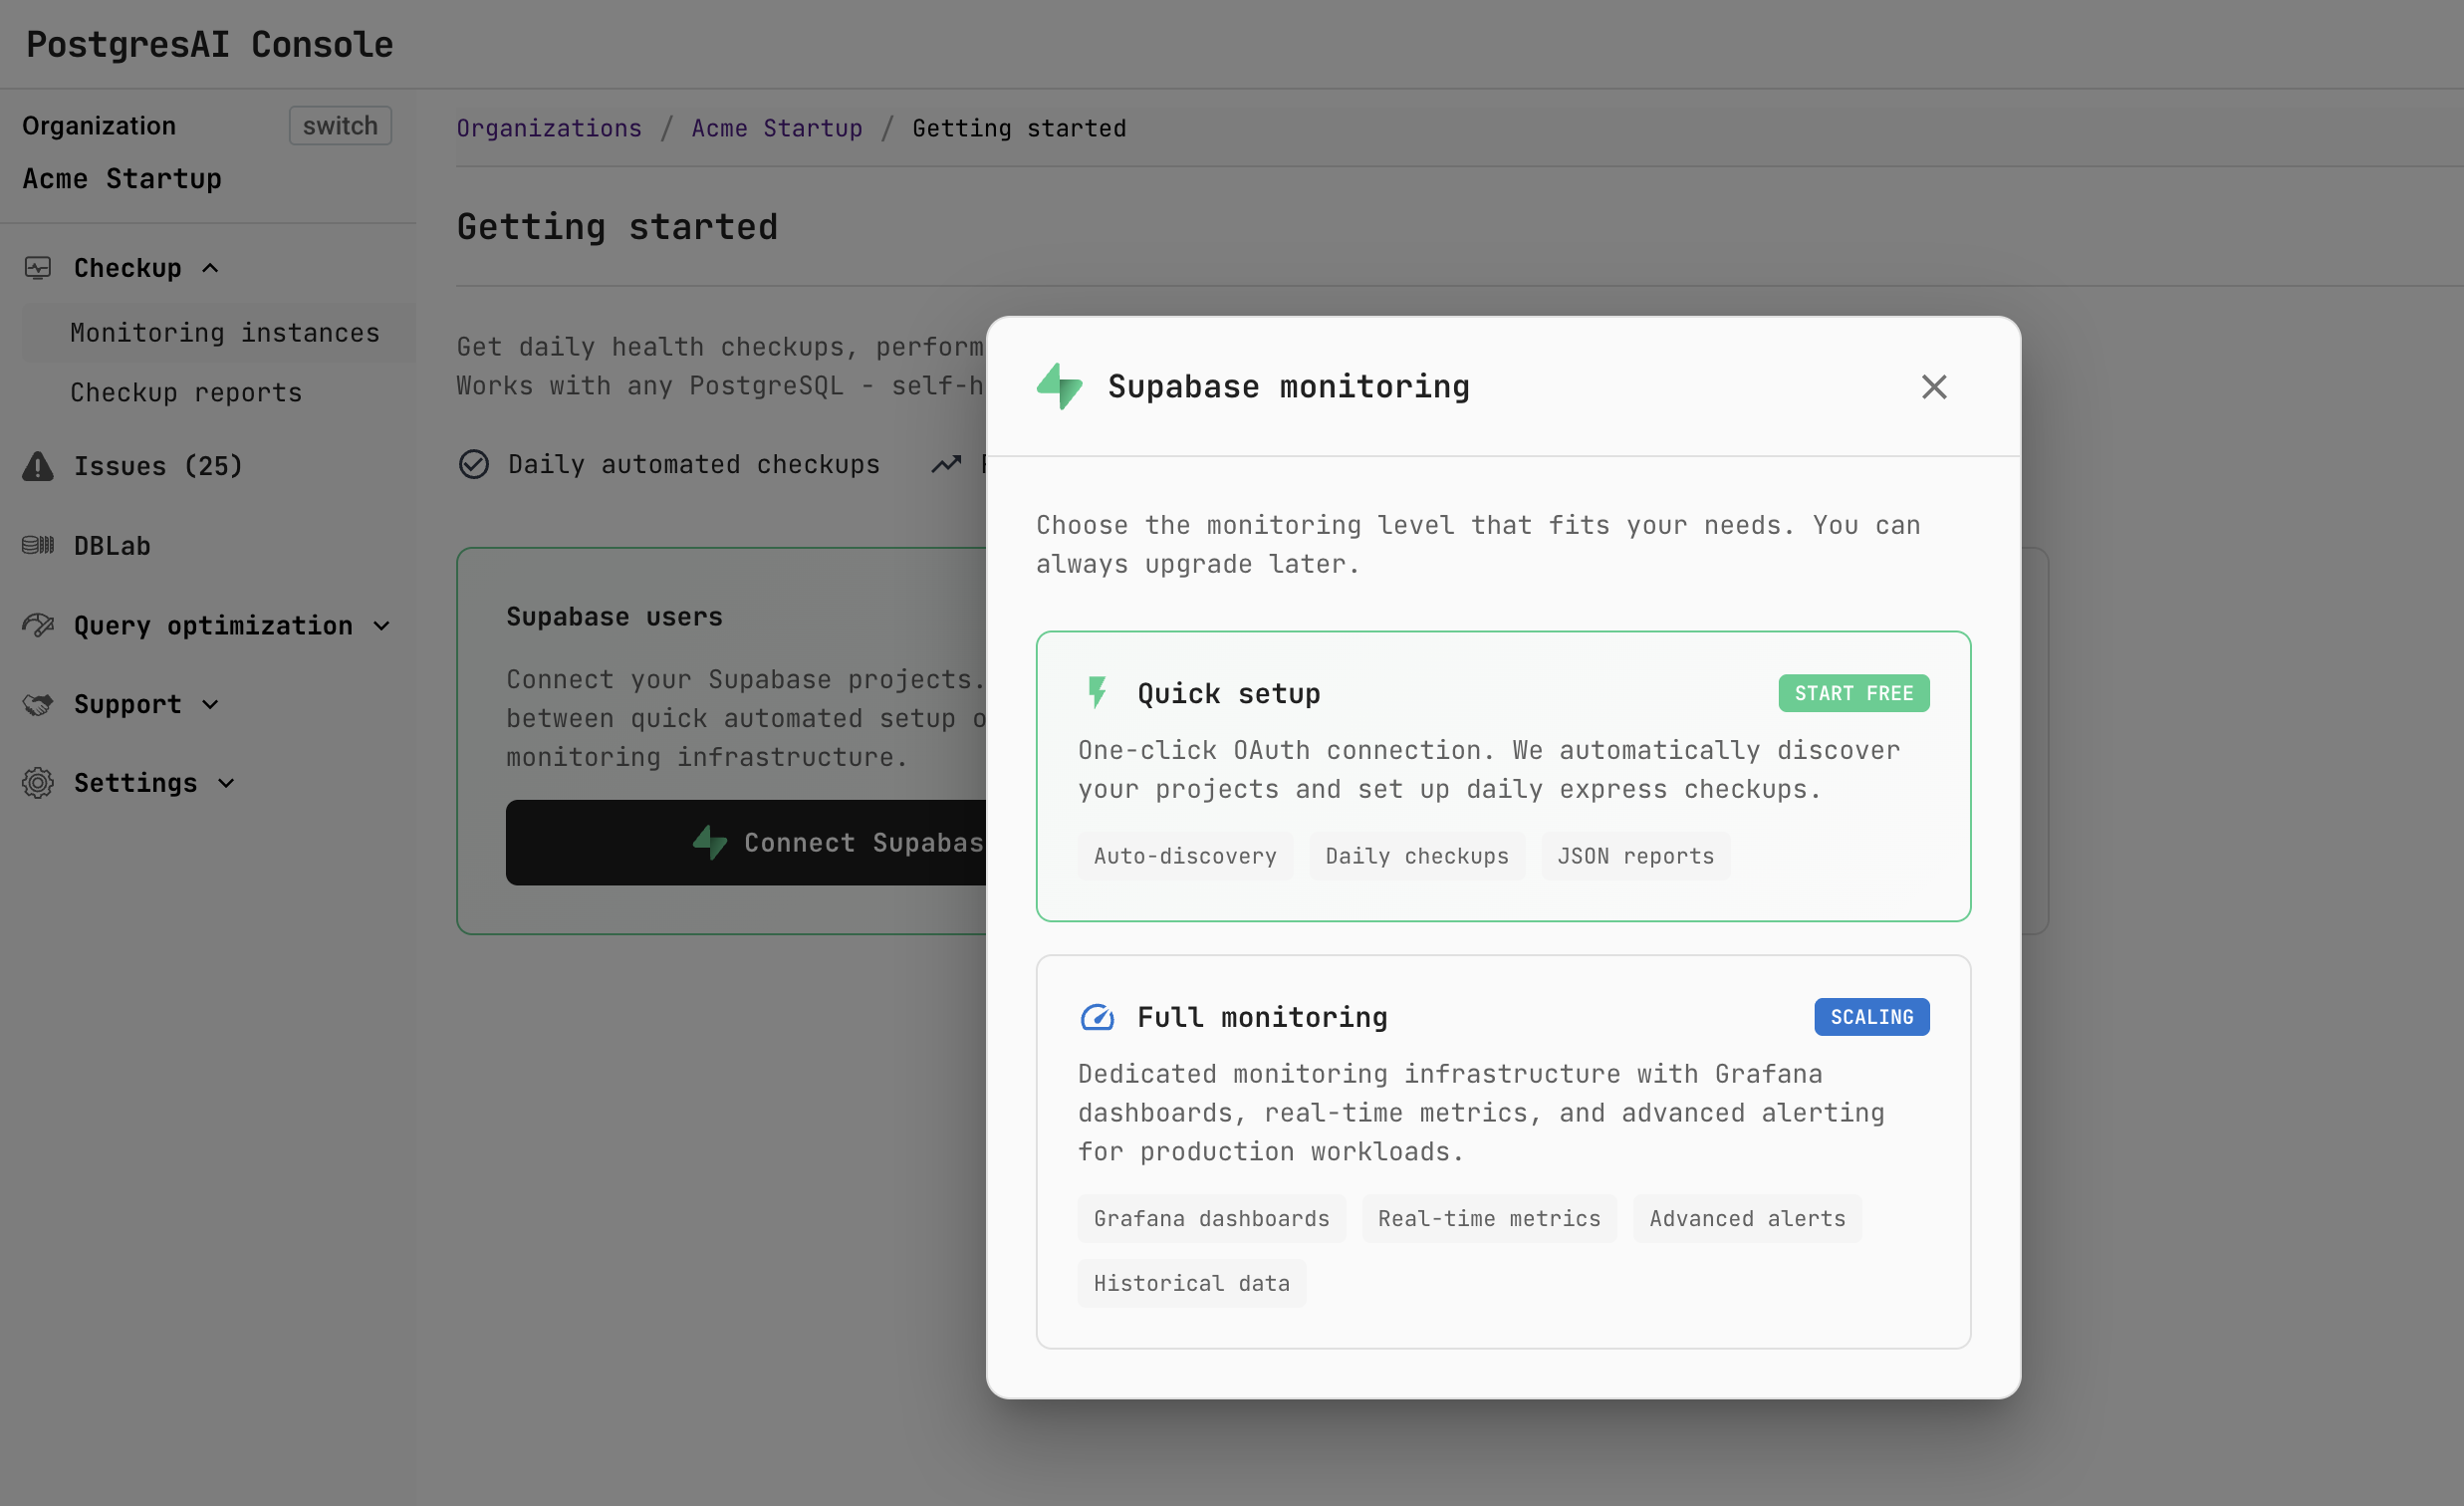
Step 2. Choose monitoring level
In the Supabase monitoring dialog, choose the monitoring level:
- Quick setup (Free) — one-click OAuth connection with auto-discovery, daily checkups, and JSON reports.
- Full monitoring (Scaling) — dedicated monitoring infrastructure with Grafana dashboards, real-time metrics, advanced alerts, and historical data.
See Pricing for the full list of available options with feature comparison.
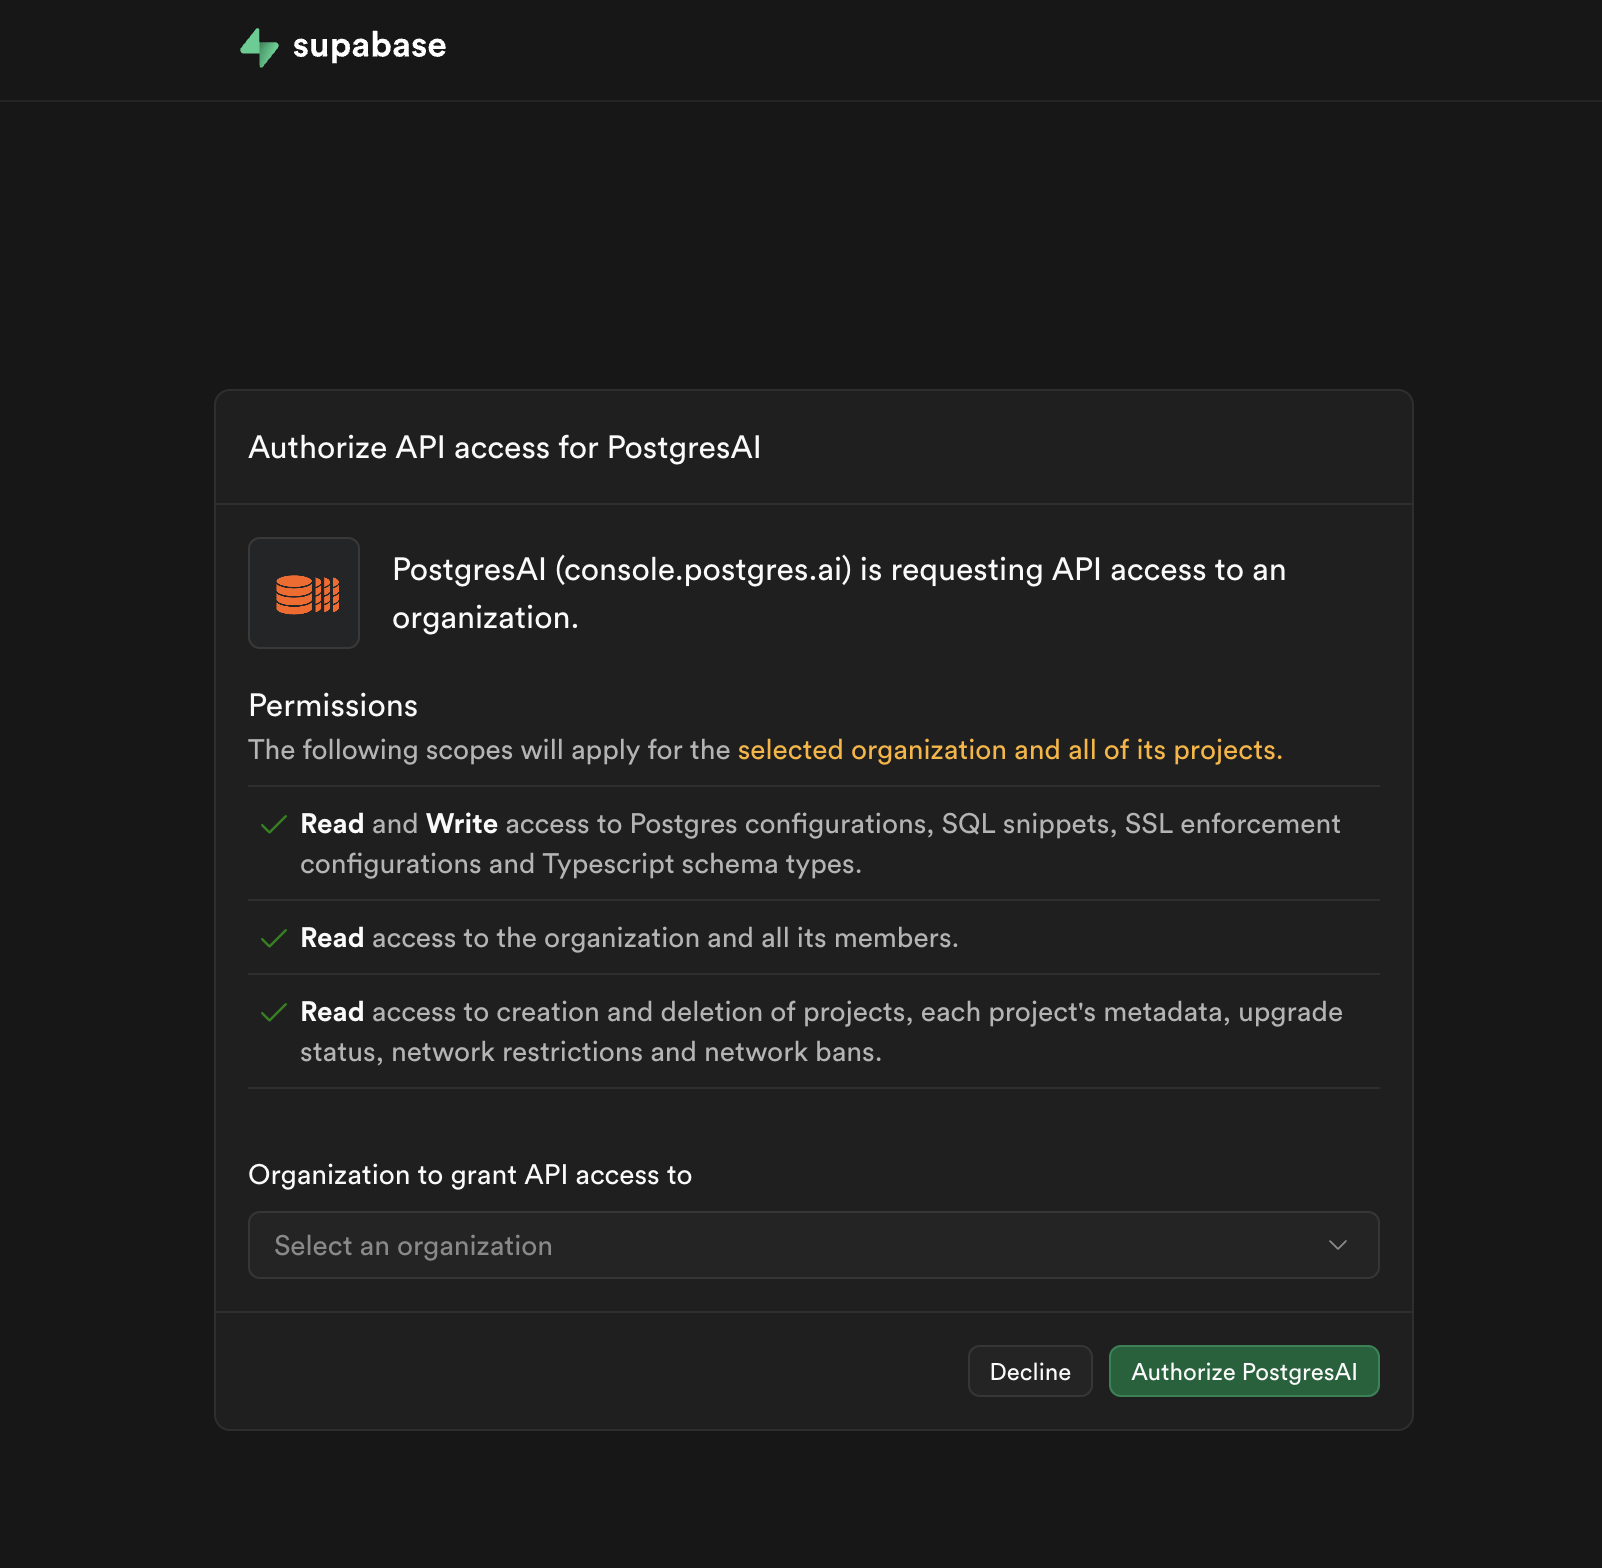
Step 3. Authorize Supabase access
After selecting a monitoring level, you are redirected to Supabase to authorize PostgresAI.
Review the requested permissions and select the organization you want to monitor, then click Authorize PostgresAI.
The requested permissions include:
- Read and Write access to Postgres configurations, SQL snippets, SSL enforcement configurations, and TypeScript schema types.
- Read access to the organization and all its members.
- Read access to project metadata, upgrade status, network restrictions, and network bans.
Step 4. Select projects and deploy
After authorization, you are returned to PostgresAI Console.
- In Billing & plan, confirm your payment method.
- In Supabase project, select the Organization and check the Projects to provision.
- Optionally, expand Advanced setup to configure SSH keys, cloud provider, or cloud region.
- Click Deploy.
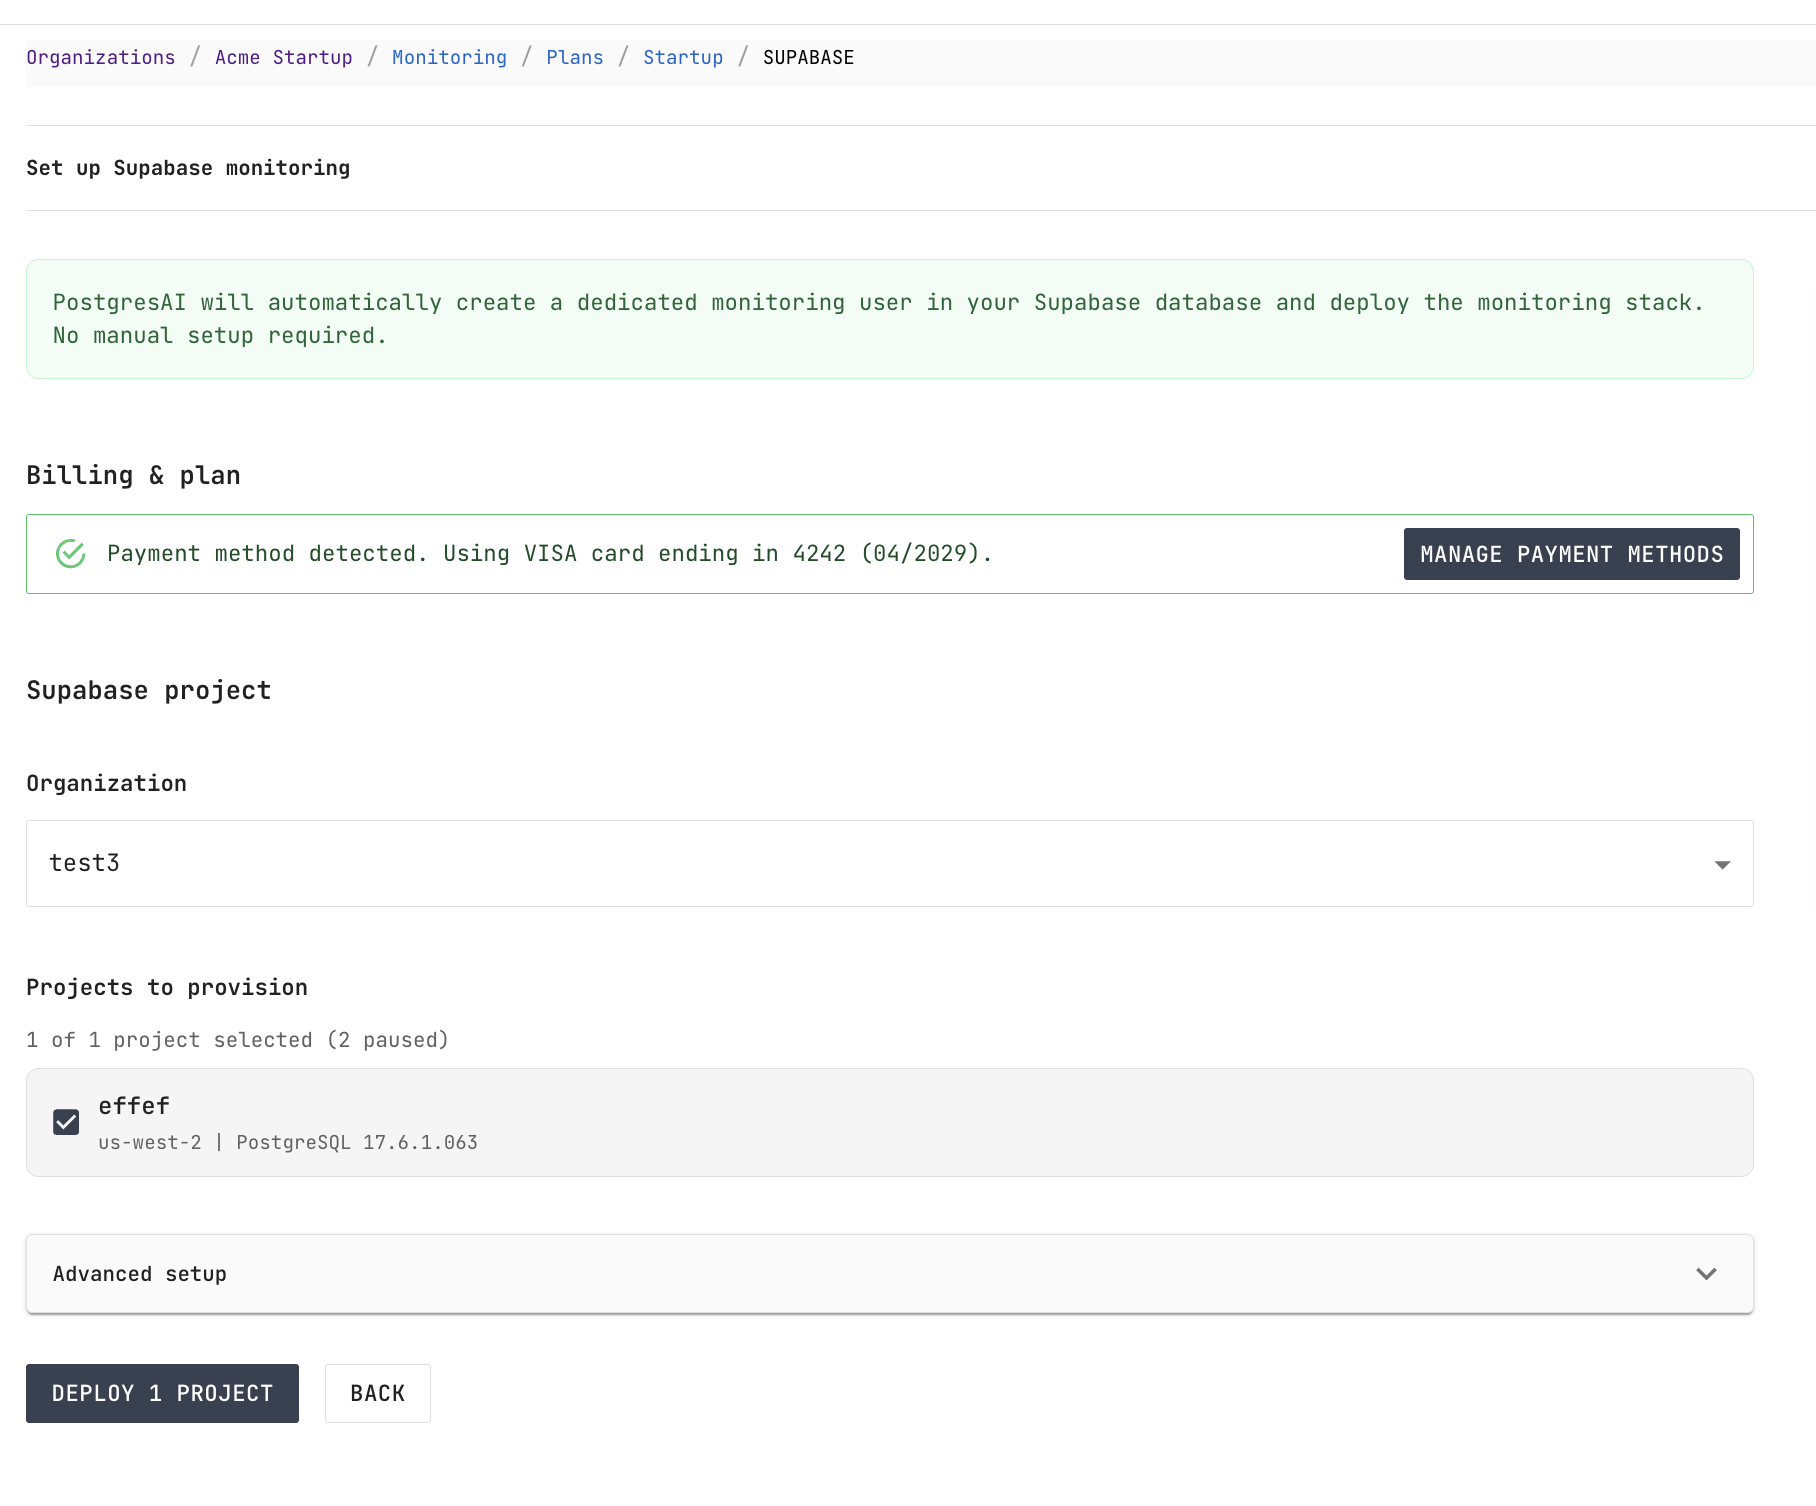
PostgresAI automatically creates a dedicated monitoring user in your Supabase database and deploys the monitoring stack. No manual database setup is required.
Step 5. Wait for deployment
After clicking Deploy, the monitoring stack is provisioned and configured. Track progress on the installation page:
- Waiting for SSH
- Provisioning VM
- Installing base packages
- Starting monitoring services
- Finishing setup
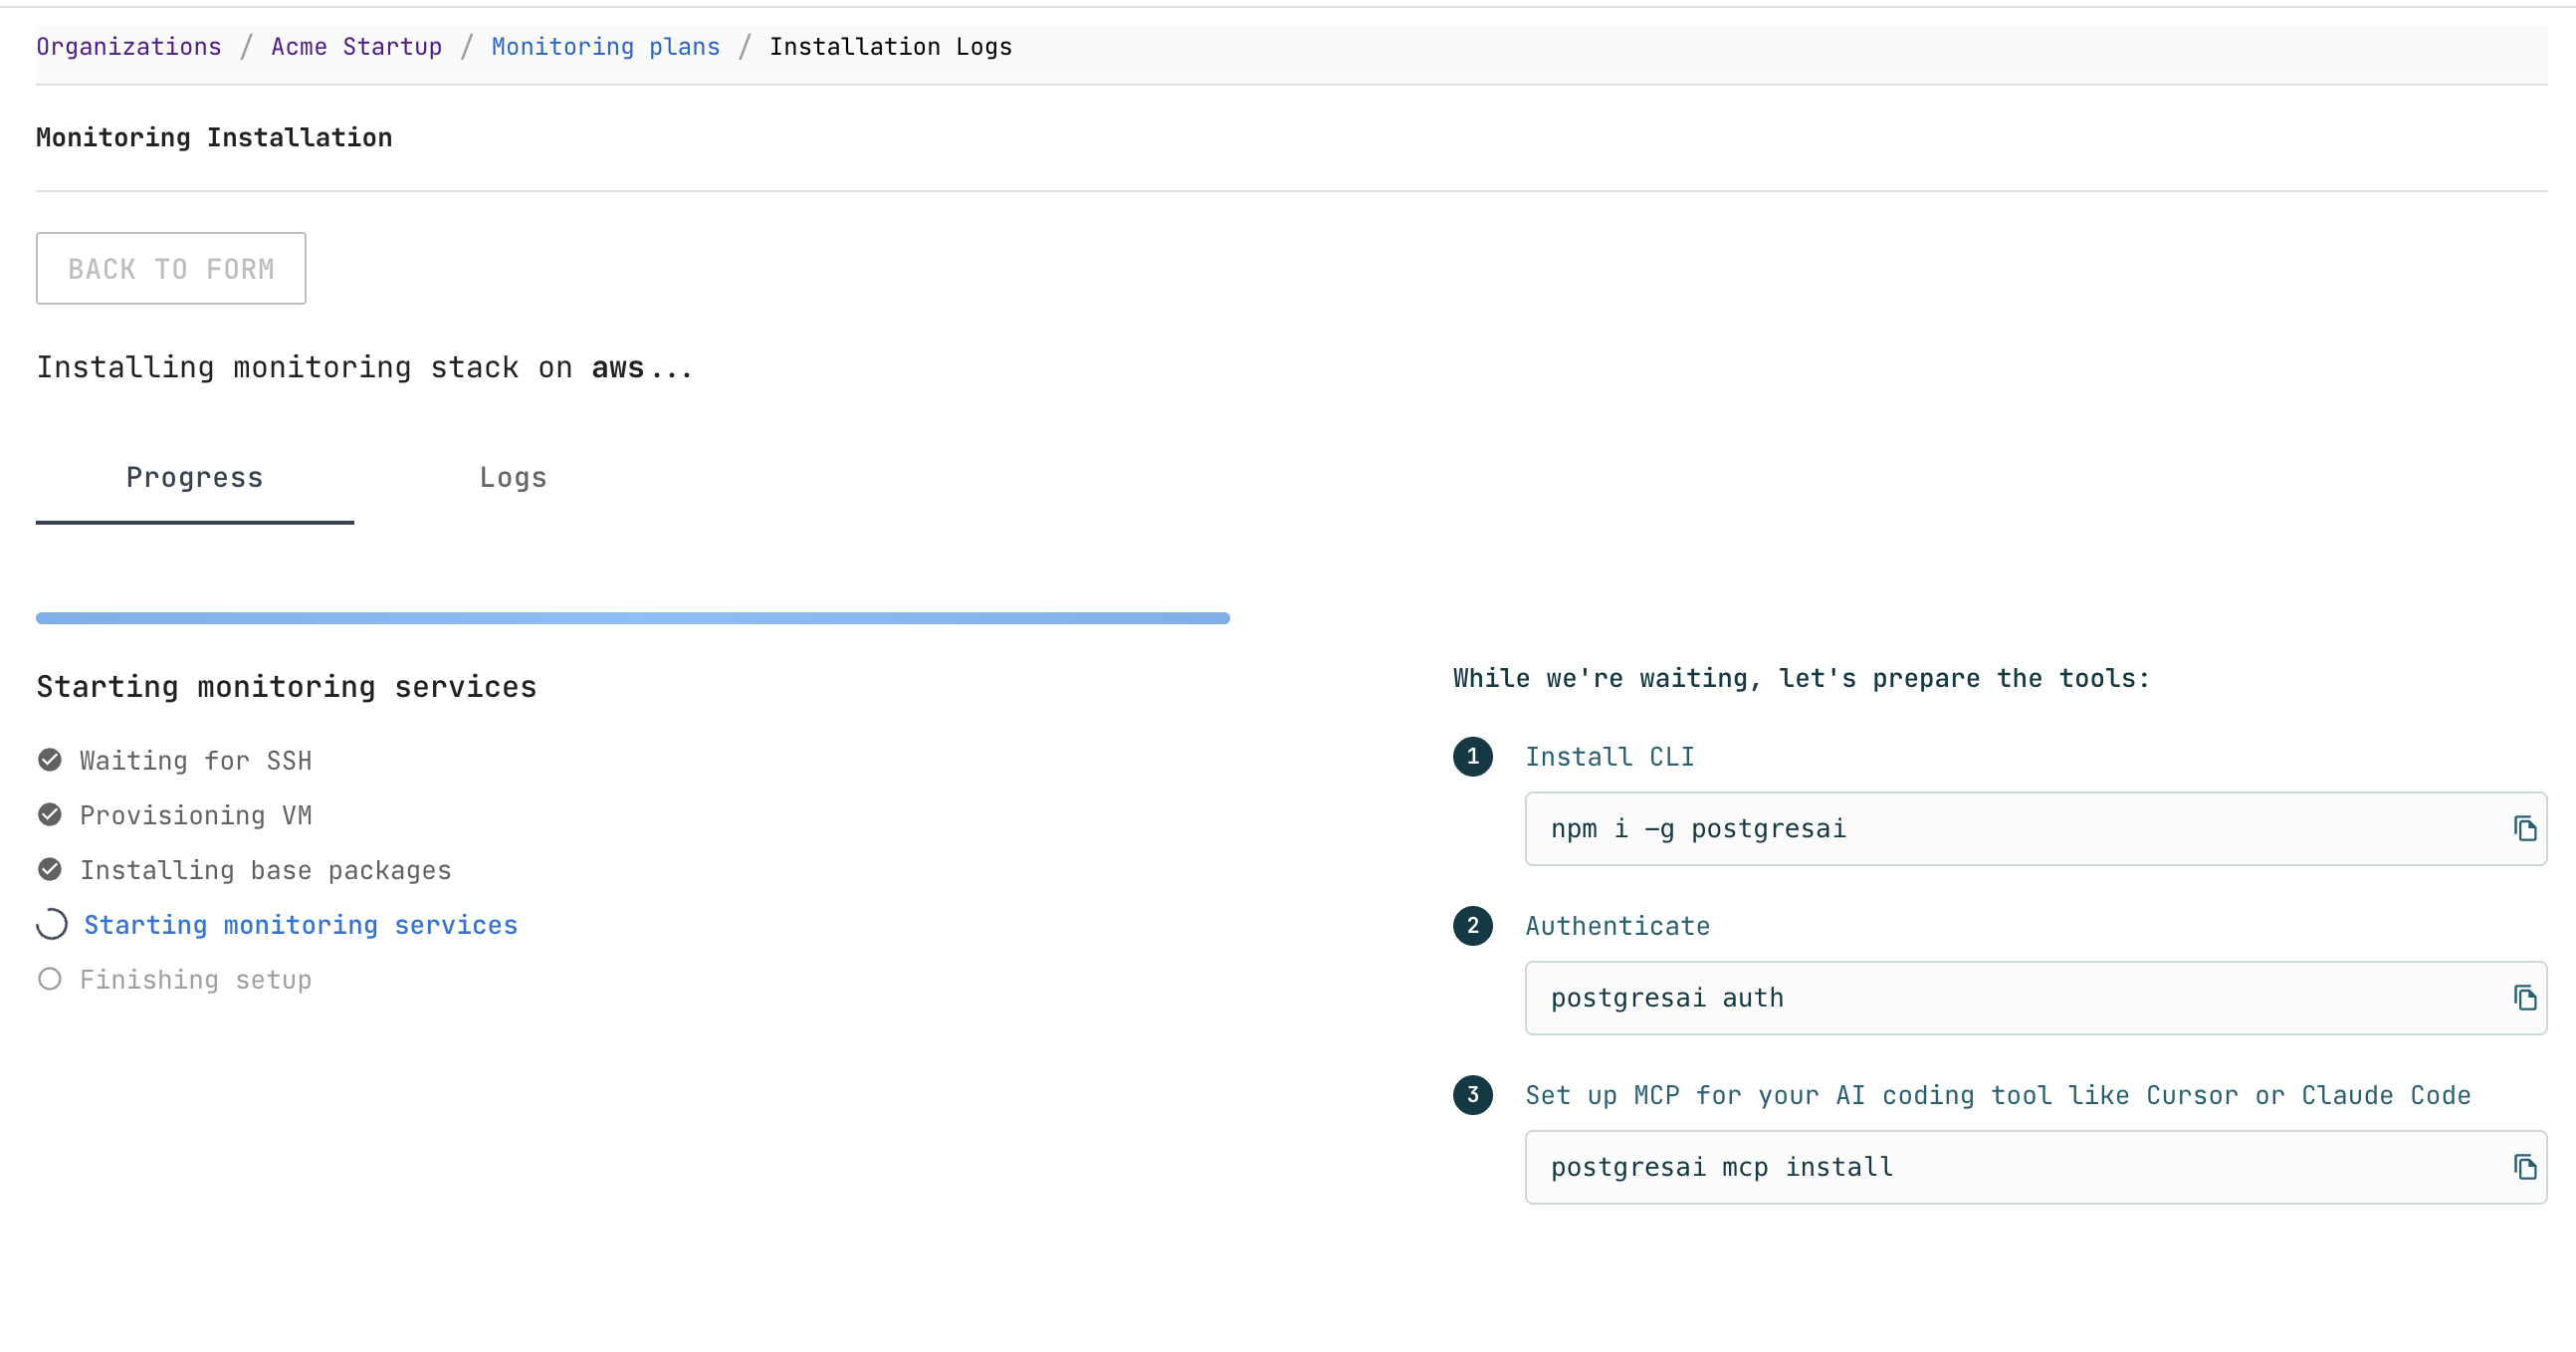
While waiting, you can set up the CLI tools:
# Install CLI
npm i -g postgresai

# Authenticate
postgresai auth

# Set up MCP for your AI coding tool (Cursor, Claude Code, etc.)
postgresai mcp install
Step 6. Save Grafana credentials
Once the deployment completes, the page shows Deployment completed successfully! with your Grafana access details:
- URL — your dedicated Grafana instance
- Username —
monitor - Password — auto-generated
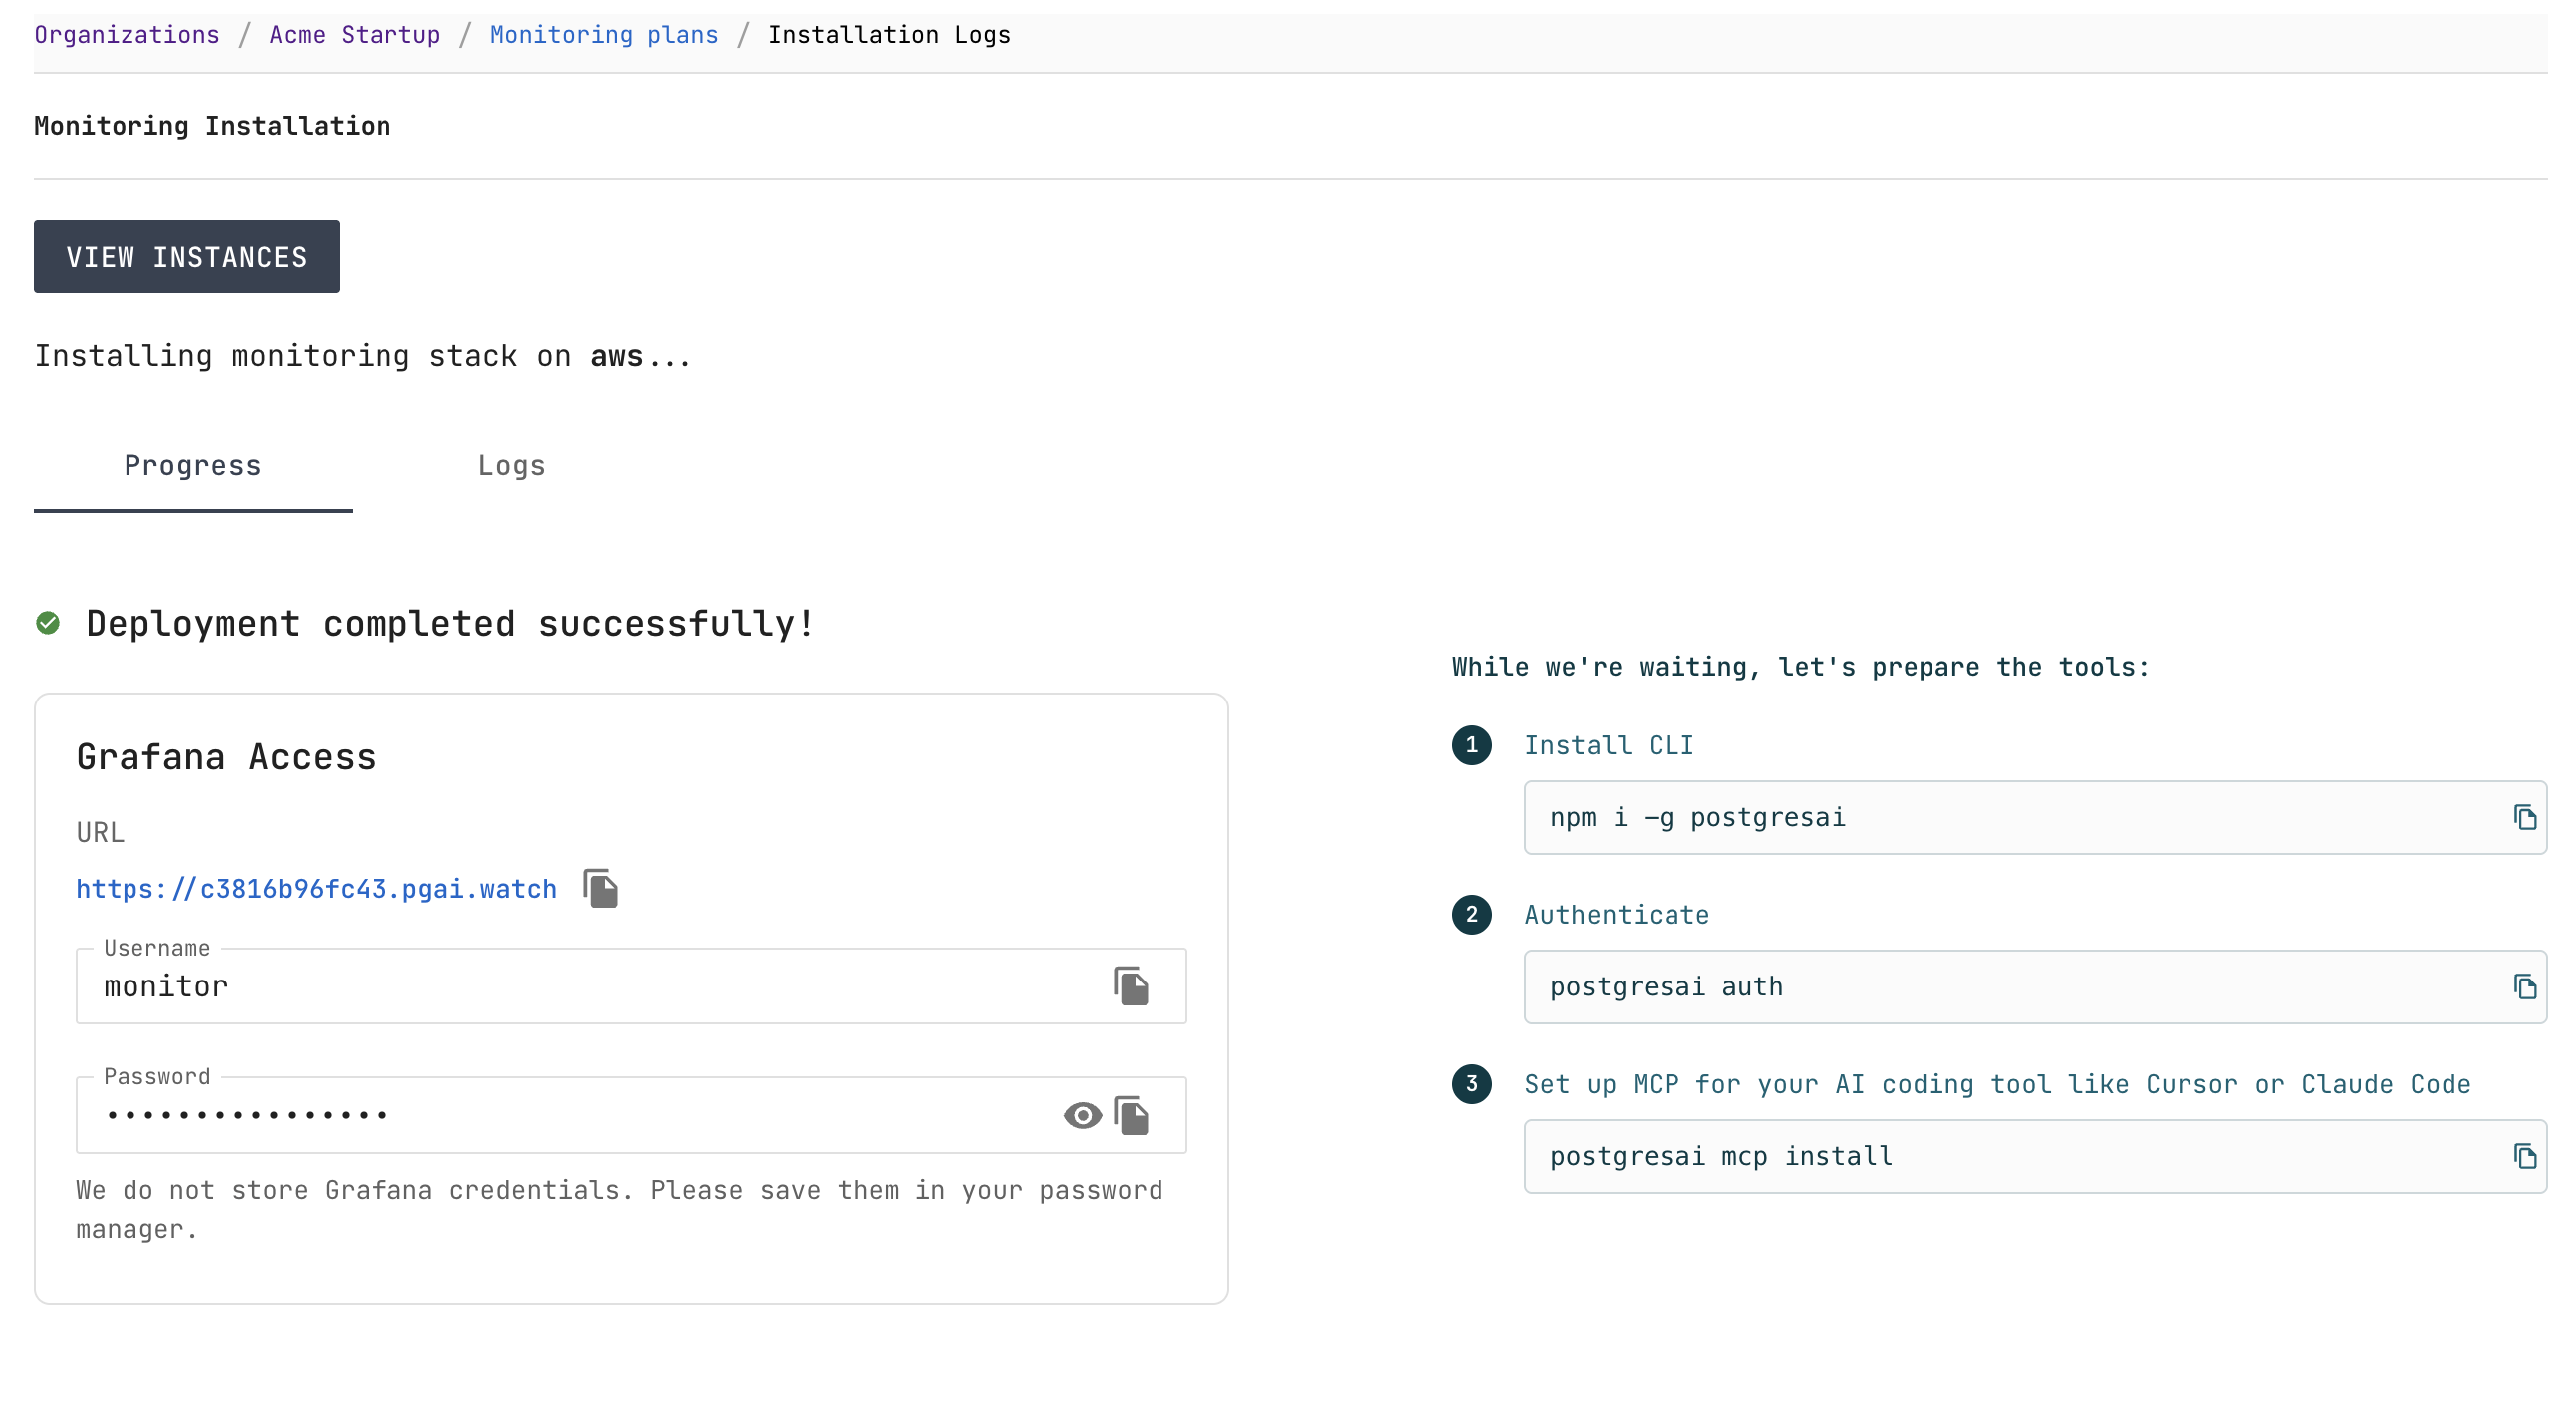
Save your Grafana credentials in a password manager — they are not stored in PostgresAI Console.
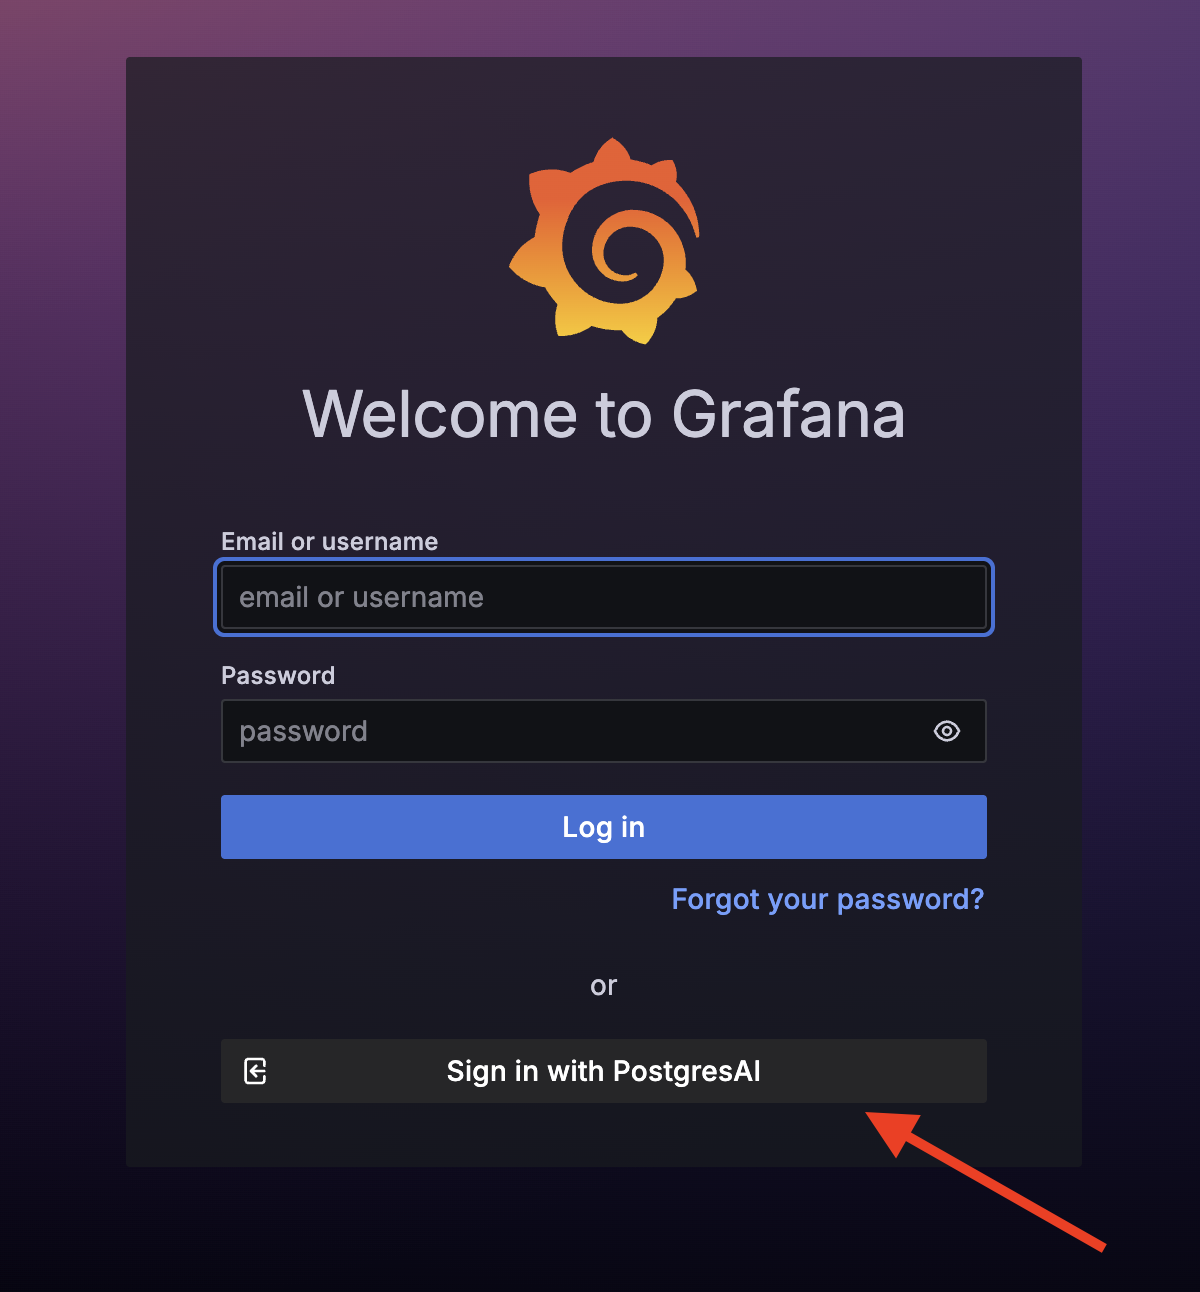
Step 7. Open Grafana dashboards
Open the Grafana URL from the deployment page. You can sign in using one of the following methods:
- Grafana credentials — use the username and password from the previous step.
- PostgresAI OAuth — click Sign in with PostgresAI for passwordless access.
Start with 01. Single node performance overview (high-level) for a high-level health check of your Supabase database. Key panels to check first:
- Active session history (ASH) — wait events over time
- Sessions — active, idle, and idle in transaction connections
- TPS — transactions per second
- QPS — queries per second
Step 8. Review first issues
After about 30 minutes, PostgresAI generates the first automated issue reports. Navigate to Issues in PostgresAI Console to see detected problems and recommended actions.
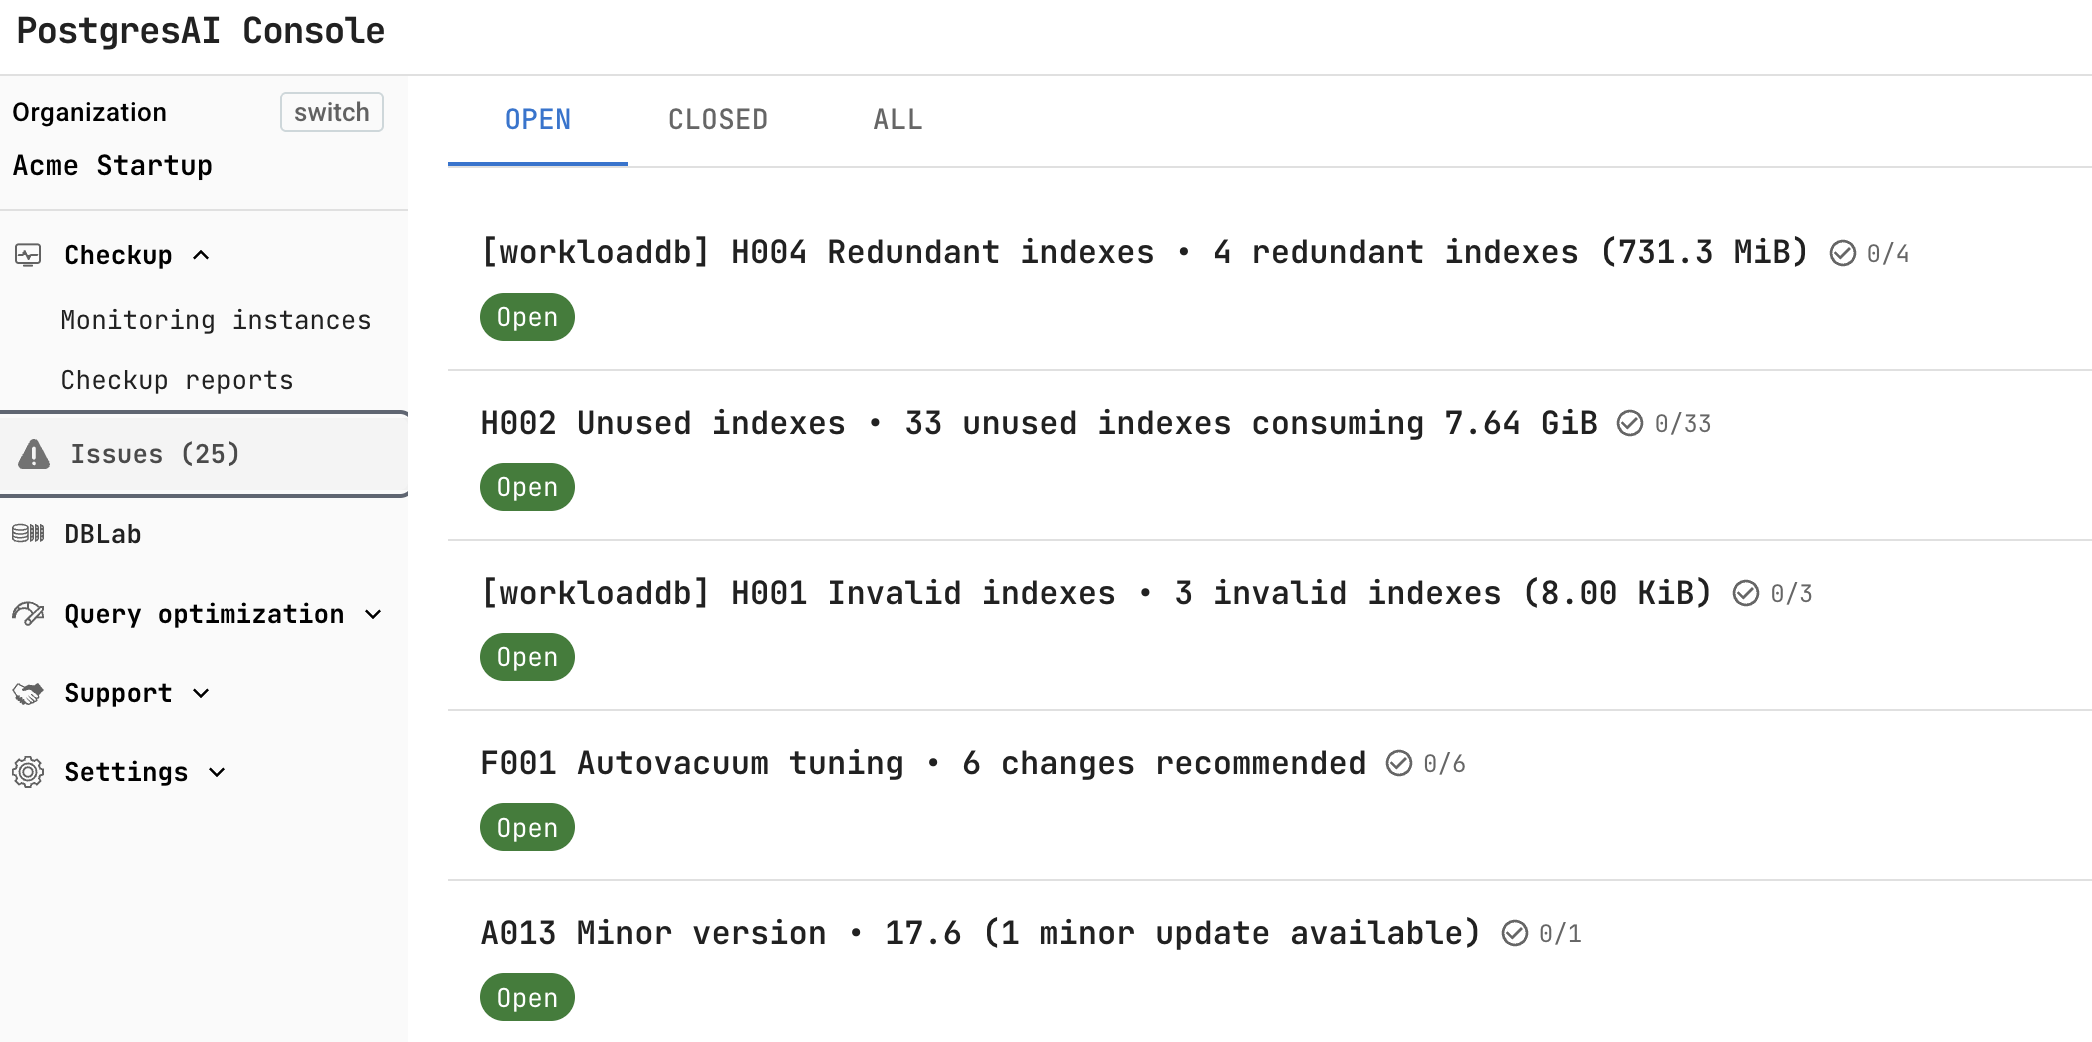
Common issues detected automatically include:
- Redundant indexes — duplicate indexes wasting storage
- Unused indexes — indexes that are never scanned
- Invalid indexes — indexes that failed to build
- Autovacuum tuning — recommended configuration changes
- Minor version updates — available PostgreSQL updates
See How to work with issues for details on managing issues, assigning team members, and integrating with AI coding tools.
Next steps
- Dashboard guide — complete dashboard reference
- PostgresAI CLI — CLI setup and commands
- MCP integration — set up MCP for Cursor, Claude Code, or other AI coding tools
FAQ
What database role is created and what permissions does it have?
The monitoring user is created automatically during Supabase setup with read-only access to metadata only. To review the exact SQL statements used to create the monitoring role:
npx postgresai@latest prepare-db --print-sql
This shows all grant statements and confirms the minimal, read-only nature of the permissions.
What data is collected from my database?
PostgresAI monitoring collects only database metadata — no actual data or query parameters. To review exactly what metrics are collected, examine the metric definitions:
- Prometheus sink metrics: metrics.yml (pgwatch-prometheus)
- PostgreSQL sink metrics (including normalized queries): metrics.yml (pgwatch-postgres)
See also: data privacy details.