Quick start guide
Get PostgresAI monitoring running in minutes with PostgresAI Cloud.
Step 1: Choose your plan
Go to console.postgres.ai and navigate to Checkup → Monitoring instances → Choose plan.
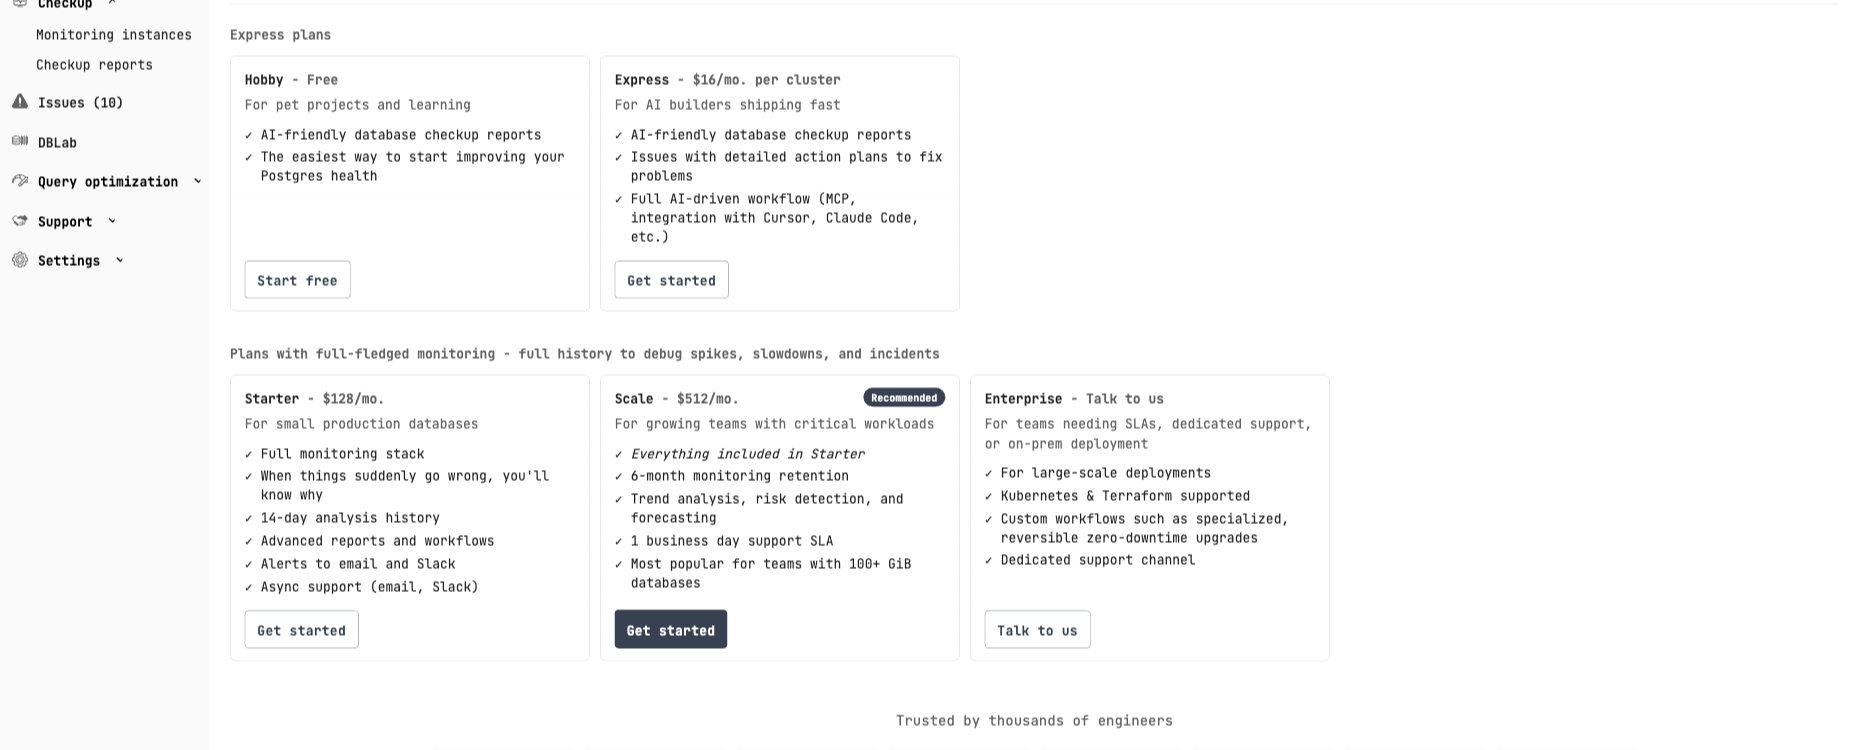
Select a plan based on your needs:
- Starter ($128/mo) — Full monitoring stack for small production databases
- Scale ($512/mo) — 6-month retention, trend analysis, 1 business day SLA
- Enterprise — Dedicated support, Kubernetes & Terraform, custom workflows
Step 2: Select deployment method
After selecting a plan, choose how to connect your database:
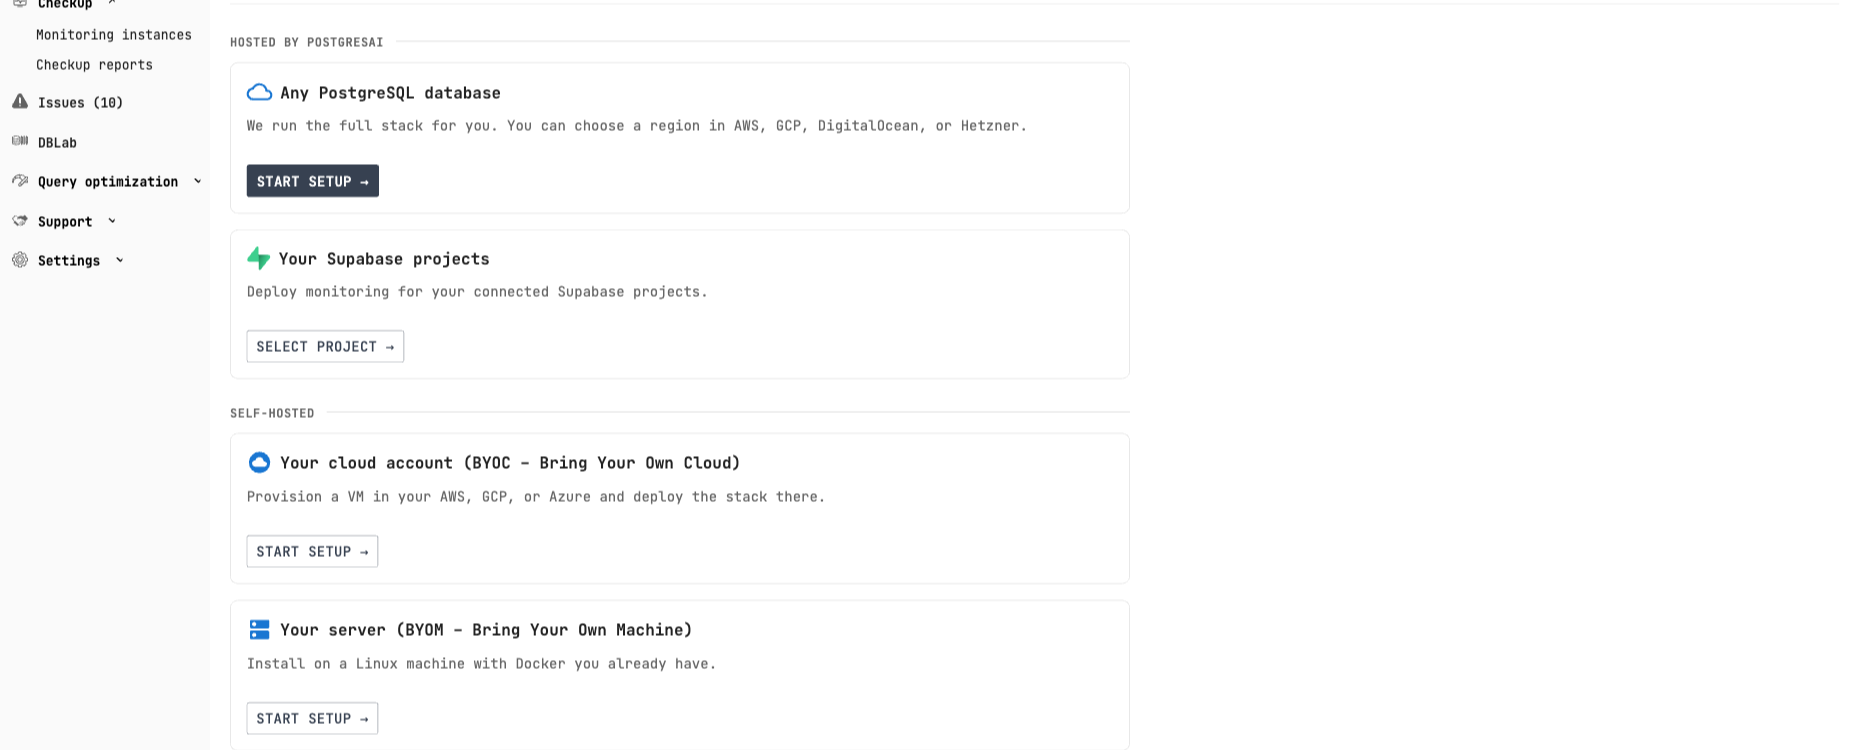
Hosted by PostgresAI:
- Any PostgreSQL database — We provision and manage the monitoring stack for you
- Your Supabase projects — One-click integration with connected Supabase projects
Self-hosted:
- Your cloud account (BYOC) — Provision in your AWS, GCP, or Azure
- Your server (BYOM) — Install on existing Linux machine with Docker
- Kubernetes — Deploy via Helm chart
Step 3: Connect your database
Option A: Supabase integration
If you have Supabase projects, select them for automatic setup:
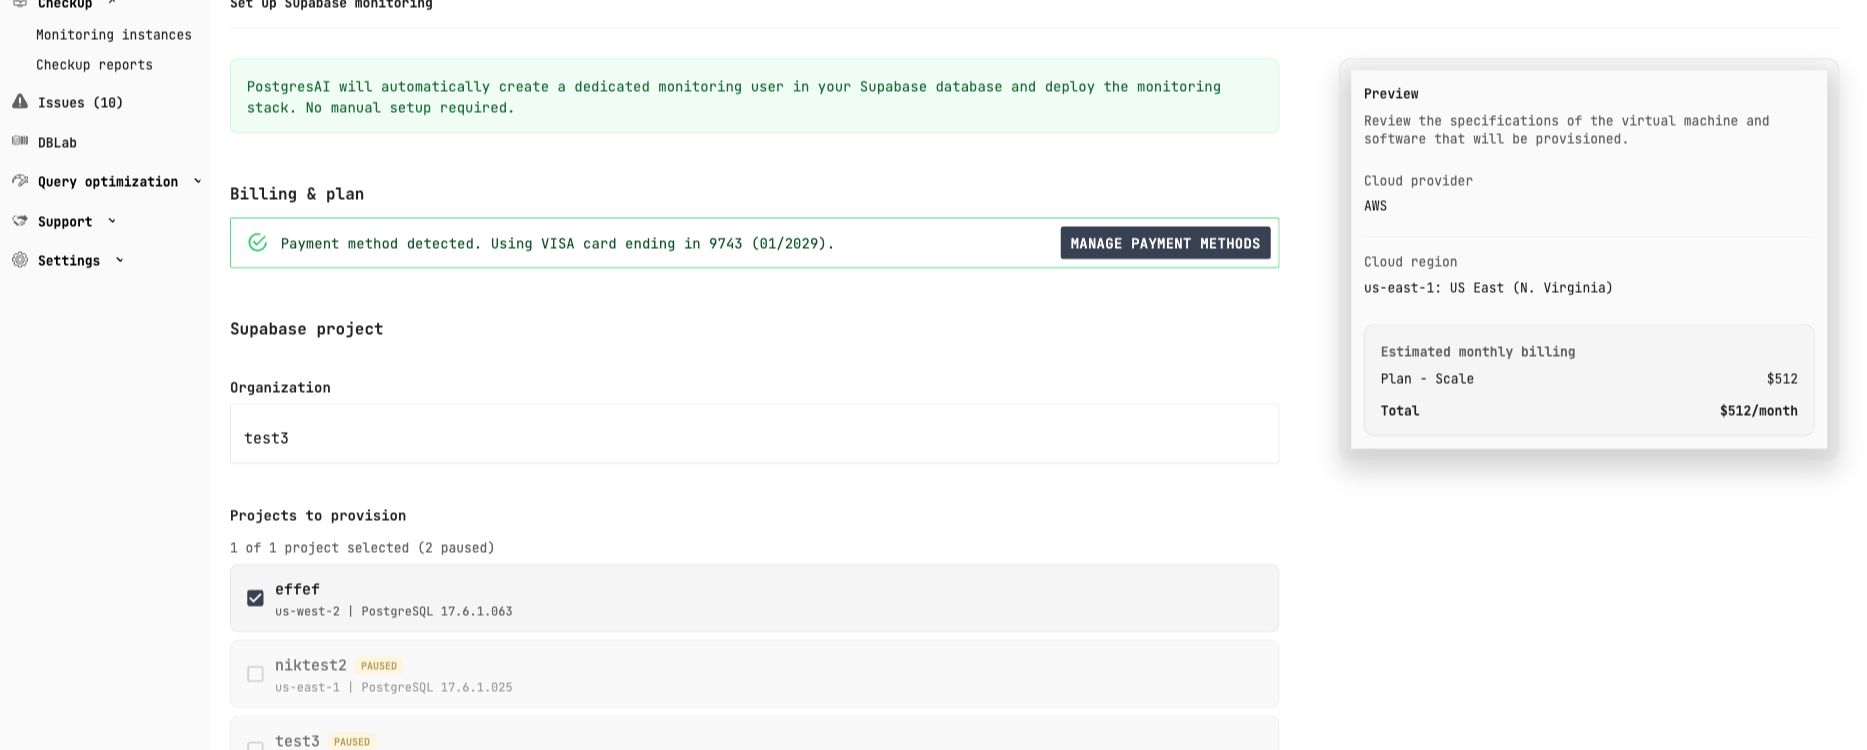
PostgresAI automatically:
- Creates a dedicated monitoring user in your Supabase database
- Deploys the monitoring stack
- No manual setup required
Option B: Any PostgreSQL database
For other PostgreSQL databases (RDS, CloudSQL, self-hosted):
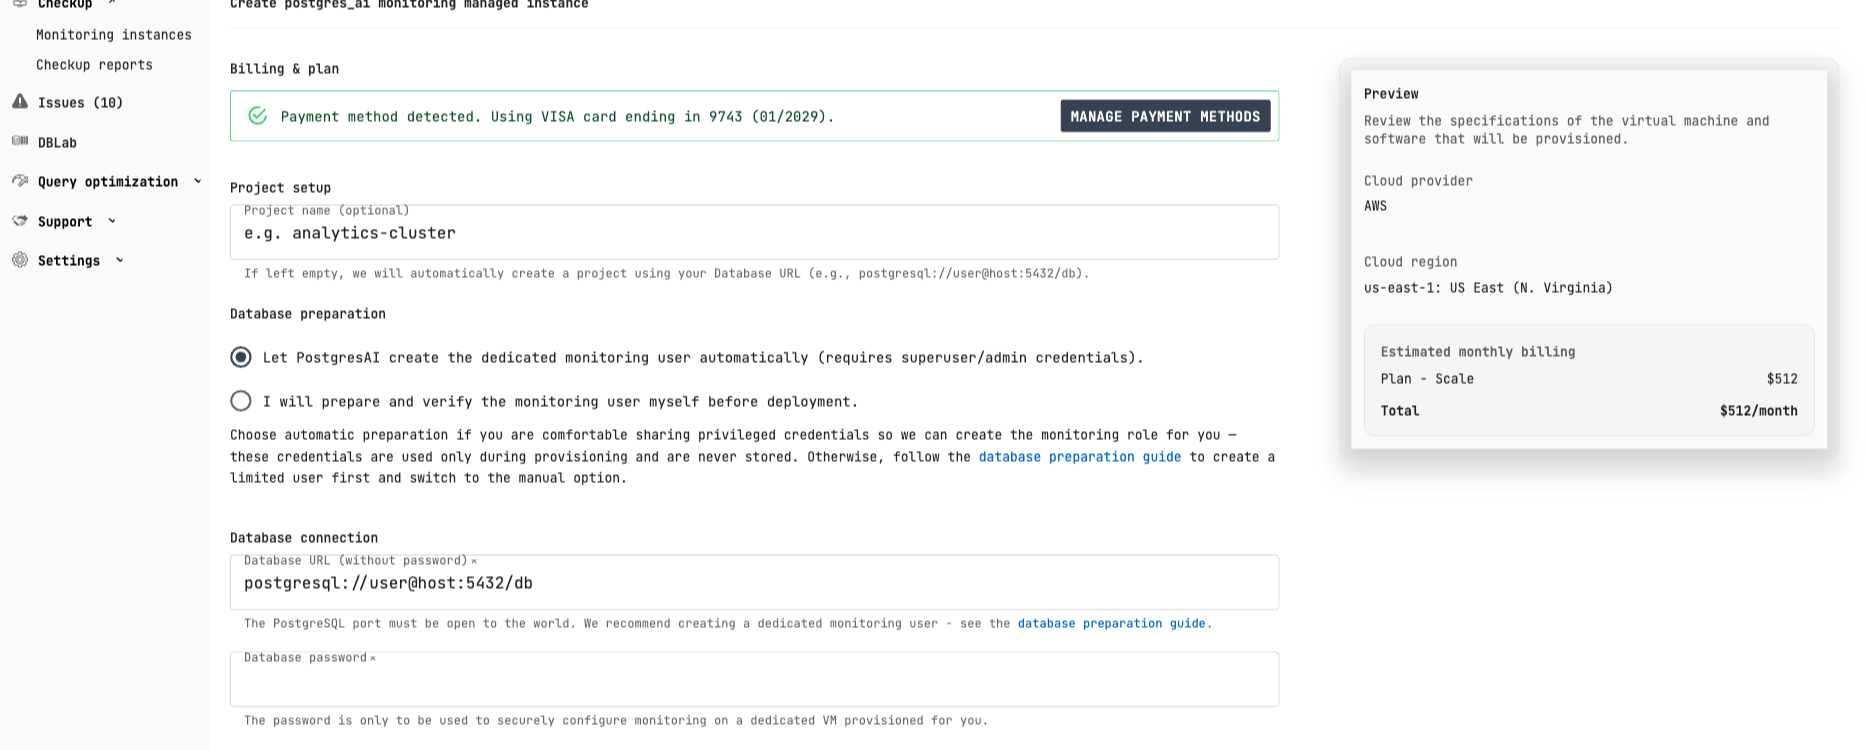
- Enter your database connection URL
- Choose automatic or manual database preparation
- Click Test Connection to verify connectivity
- Deploy the monitoring stack
For automatic setup, provide superuser credentials (used once, never stored). For manual setup, follow the database preparation guide.
Step 4: Access your dashboards
Once deployed, you'll receive:
- Grafana URL with your dashboards
- Login credentials
Start with 01. Node overview for a high-level health check.
Verify database permissions
The monitoring user has read-only access to metadata only. To review the exact SQL statements used to create the monitoring role:
npx postgresai@latest prepare-db --print-sql
This shows all grant statements and confirms the minimal, read-only nature of the permissions.
What data is collected?
Only database metadata is collected — no actual data or query parameters:
- Query statistics from
pg_stat_statements(normalized queries only) - Wait events and session information
- Table and index statistics
- Replication status
To review exactly what metrics are collected, examine the metric definitions:
- Prometheus sink metrics: metrics.yml (pgwatch-prometheus)
- PostgreSQL sink metrics (including normalized queries): metrics.yml (pgwatch-postgres)
See data privacy details.
First dashboard walkthrough
Key panels to check in 01. Node overview:
- Active session history (ASH) — Wait events over time (similar to RDS Performance Insights)
- Sessions — Active, idle, and idle in transaction connections
- TPS — Transactions per second
- QPS — Queries per second
Decision tree: which dashboard to use?
Is there an ongoing incident?
├─ Yes — Start with "01. Node Overview" for quick triage
│        └─ High wait events? — "04. Wait Events" for deep-dive
│        └─ Slow queries? — "02. Query Analysis" then "03. Single Query"
│        └─ Lock contention? — "13. Lock Contention"
│
├─ No, routine monitoring
│   ├─ Query performance review — "02. Query Analysis"
│   ├─ Index health check — "10. Index Health"
│   ├─ Table bloat check — "07. Autovacuum" or "08. Table Stats"
│   └─ Replication lag — "06. Replication"
Self-hosted alternative
If you prefer to run the monitoring stack on your own infrastructure:
| Method | Best for |
|---|---|
| Cloud databases | RDS, CloudSQL, Supabase specifics |
| Helm | Kubernetes production |
| Docker Compose | Development, small deployments |
| CLI (npx) | Quick local setup, demos |
Next steps
- Dashboard guide — Complete dashboard reference
- System requirements — Hardware and software requirements