How to install PostgresAI monitoring from Console
Use PostgresAI Console to start the PostgresAI monitoring installation and connect your Postgres instance(s).
What you get
- Monitoring stack: dashboards and metrics collection for Postgres.
- Daily reports as issues: recurring issue reports with detected problems and recommended actions. These issues can be integrated into a Cursor-based team workflow, including one-click actions from the issue.
- MCP integrations via CLI: MCP is available for Claude Code, Cursor, Windsurf, and Codex.
- Works with Postgres anywhere: AWS RDS, Google CloudSQL, Heroku Postgres, DigitalOcean Postgres, Supabase, Timescale Cloud, and self-managed Postgres.
Prerequisites
- Sign up for an account in PostgresAI Console using one of the supported methods: Google, LinkedIn, GitHub, or GitLab.
- Create a new organization.
- In your organization, open Billing and add a payment method:
- Click Edit payment methods.
- The Stripe portal will open (URL format:
https://billing.stripe.com/...). - Add your payment method in Stripe and close the page.
Monitoring installation
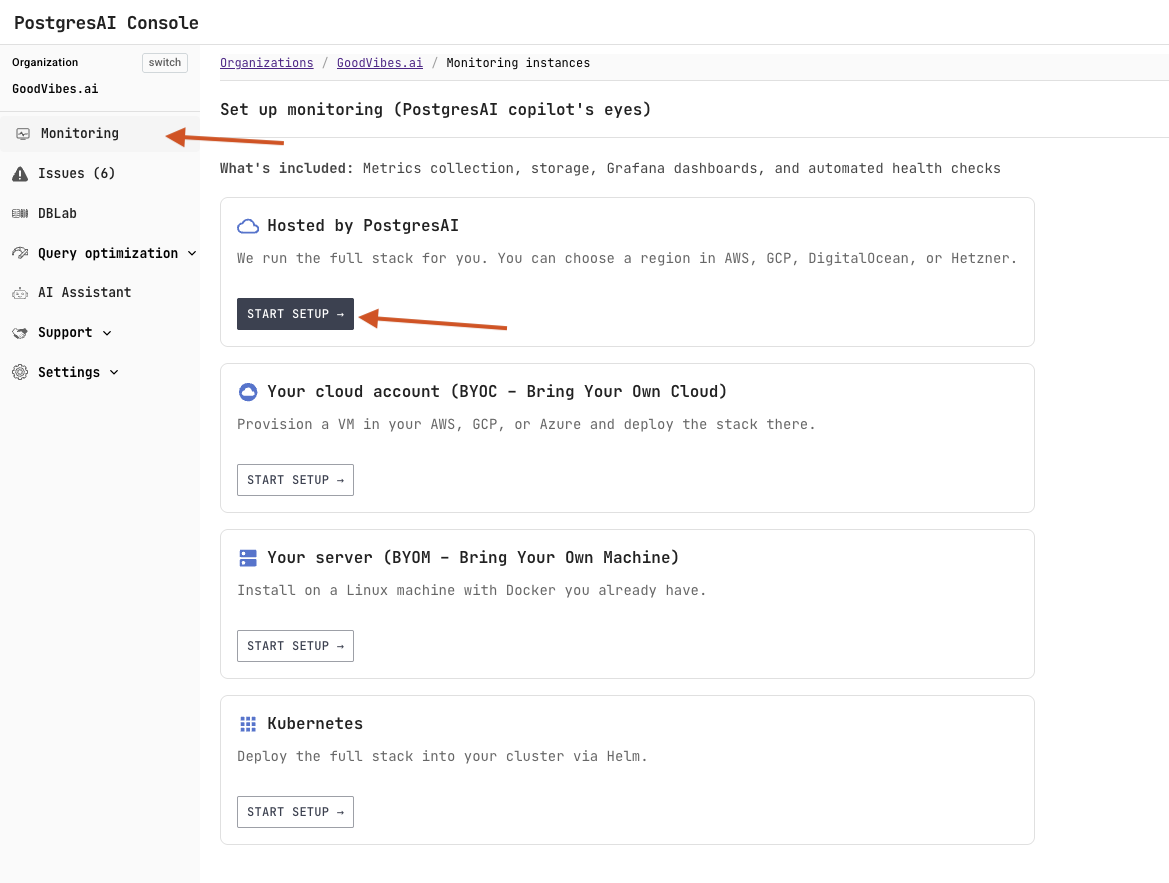
Open Monitoring in the left sidebar, then click Start setup in Hosted by PostgresAI.
On the Create PostgresAI monitoring managed instance page:
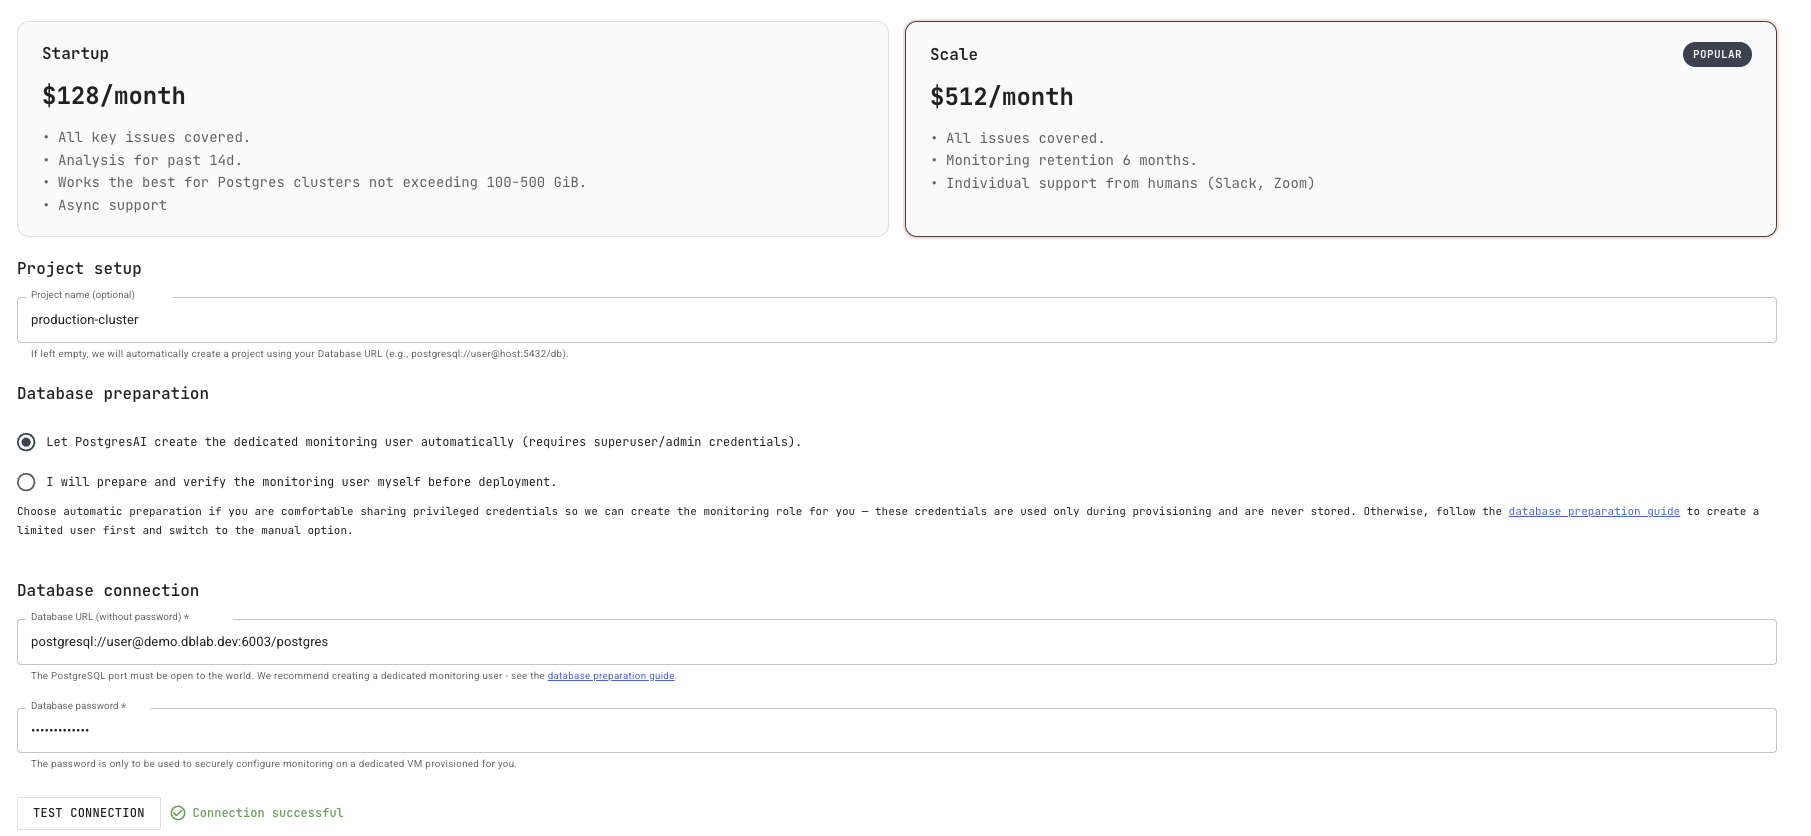
- In Billing & plan, select the plan that matches your needs. If you need to update payment details, use Manage payment methods.
- In Project setup, optionally set Project name (if left empty, it is generated automatically).
- In Database preparation, choose one of the options:
- Automatic: PostgresAI creates a dedicated monitoring user automatically (requires admin credentials during provisioning; these credentials are not stored and are only used to create the monitoring user with the required privileges, which is then used for ongoing monitoring).
- Manual: you prepare and verify the monitoring user before deployment.
- In Database connection, provide:
- Database URL (without password)
- Database password
- Click Test connection and confirm you see Connection successful.
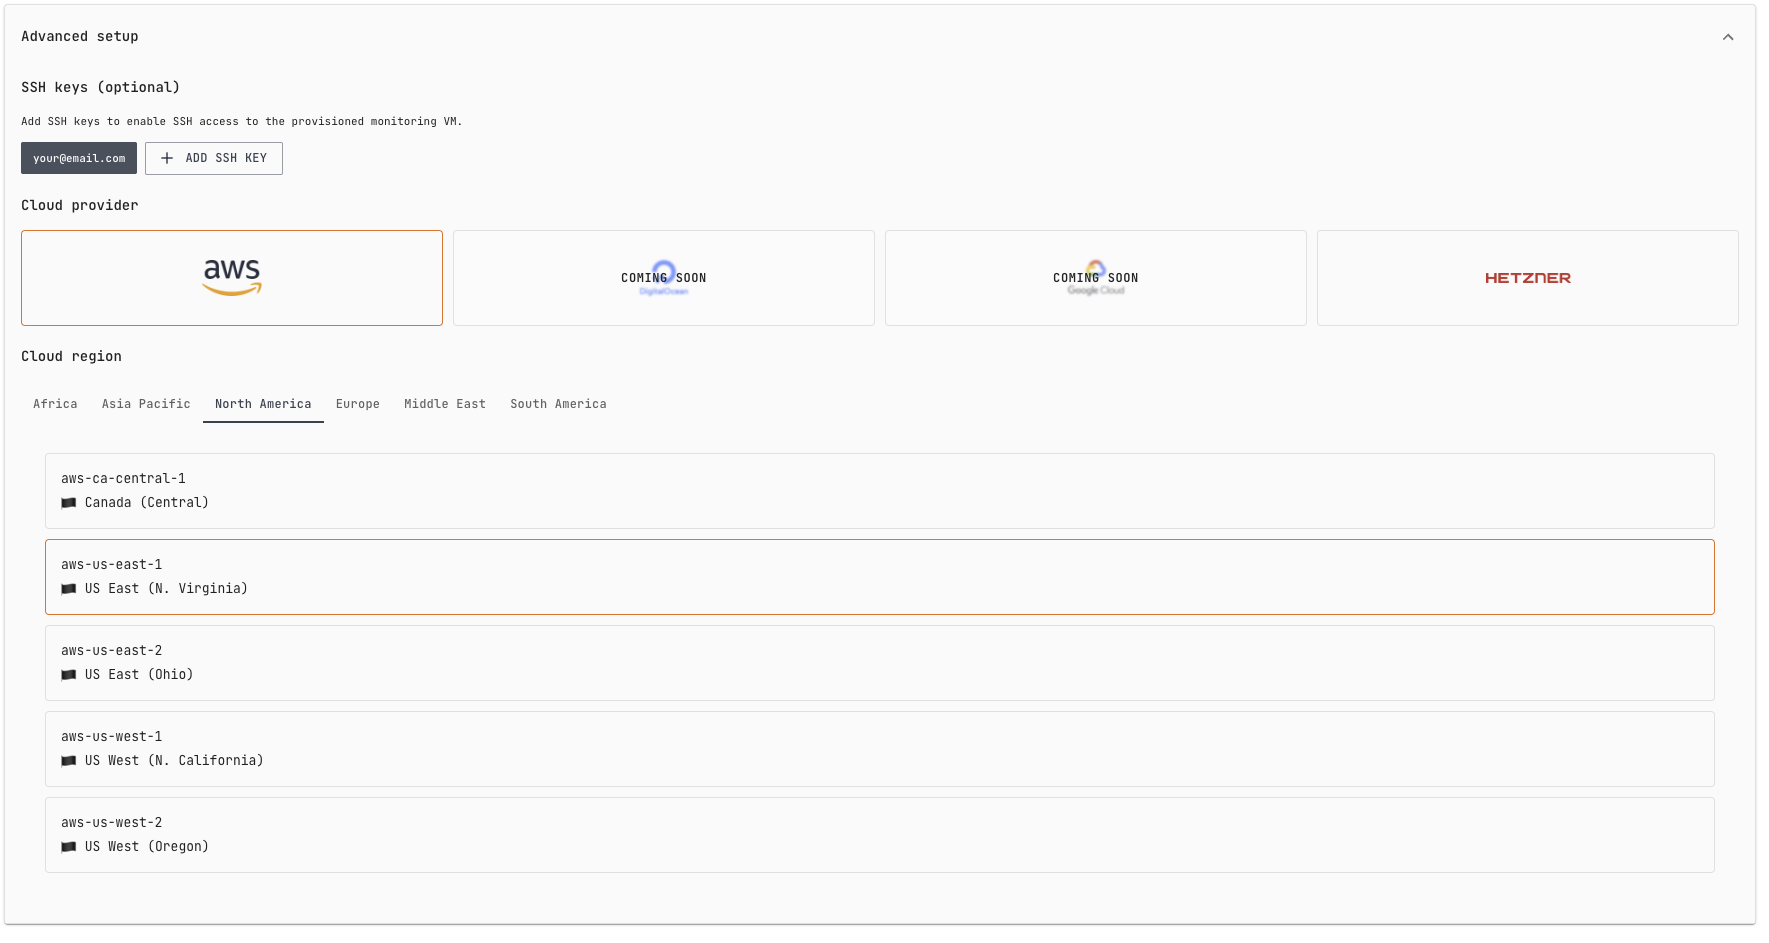
Advanced setup (optional)
Use Advanced setup to adjust access and provisioning details for the monitoring VM:
- SSH keys (optional): add SSH keys if you need SSH access to the provisioned monitoring VM.
- Cloud provider: select where the monitoring VM will be provisioned (for example, AWS or Hetzner).
- Cloud region: choose the geographic region for the monitoring VM. For best results, pick a region closest to where your Postgres instance is running.
Deploy
Review the configuration to confirm everything is filled in correctly, then click Deploy.
Wait for deployment
After you click Deploy, wait for the monitoring stack to be provisioned and configured. Use Progress to track the current step.
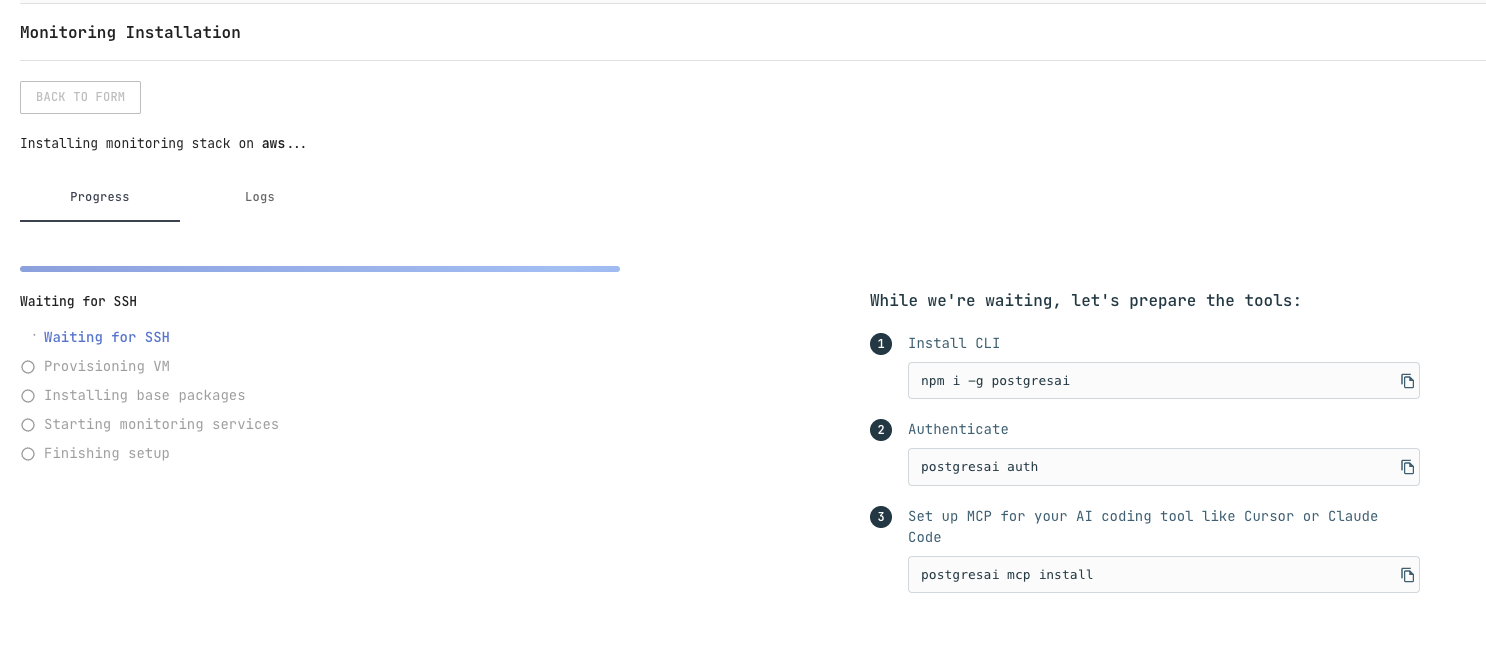
While waiting, you can optionally set up the CLI tools — see PostgresAI CLI.
After deployment
After the deployment completes, you will see a confirmation message and the Grafana access details:
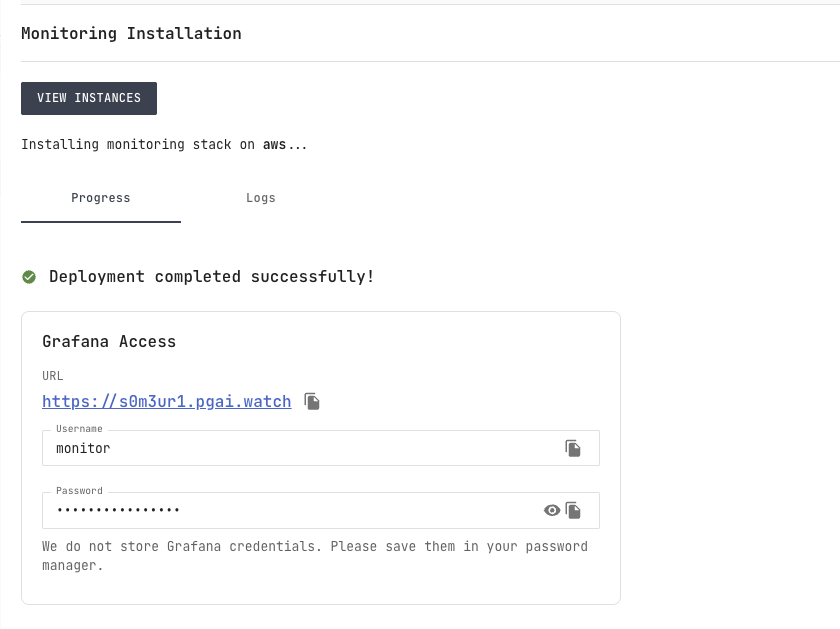
- URL: open the Grafana URL provided on the page.
- Username / password: use the credentials shown in the form.
- Save your credentials: Grafana credentials are not stored in PostgresAI Console, so save them in your password manager.
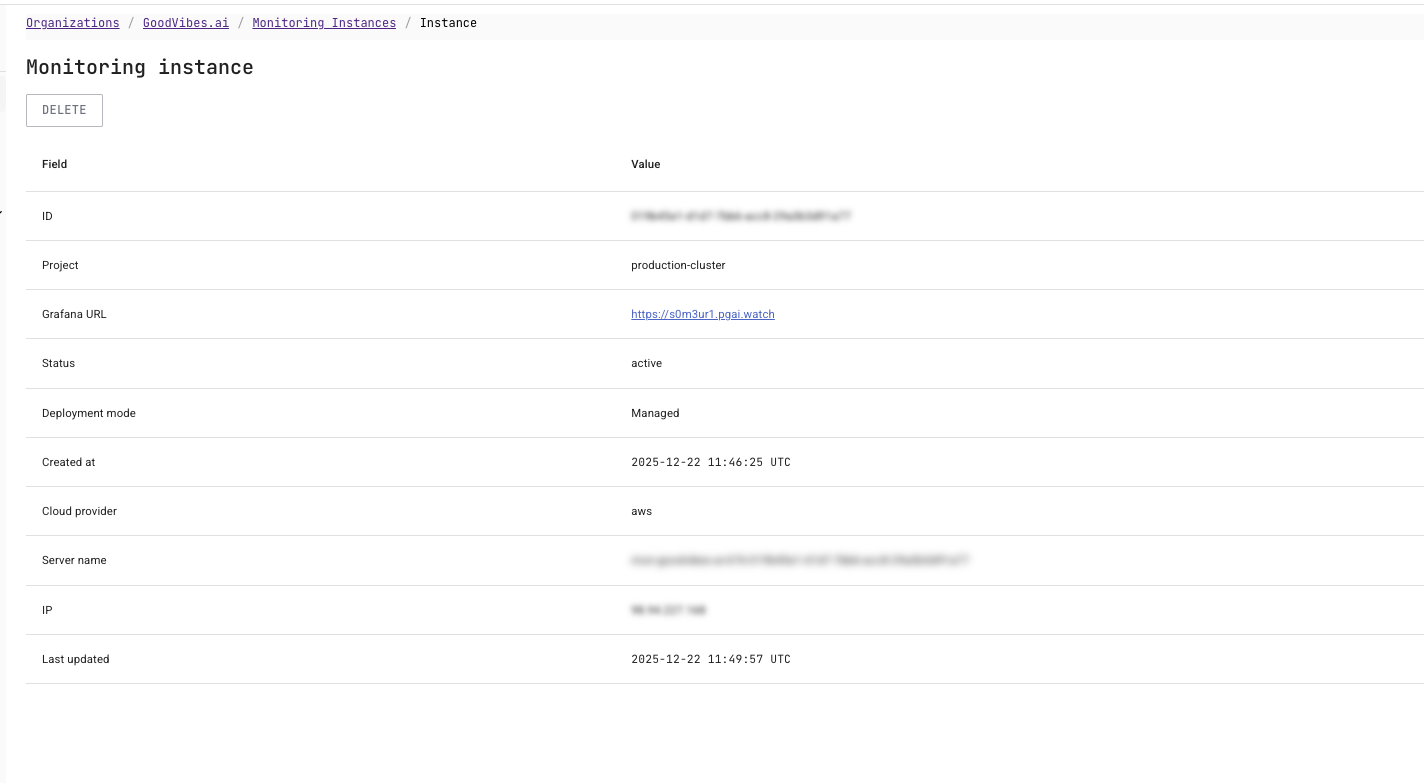
View the instance page
You can open the instance details page from the instances list:
- In the left sidebar, click Monitoring to open Monitoring instances.
- Select your instance in the list to open the Monitoring instance page.
- Review the instance details such as status, Grafana URL, and IP address.
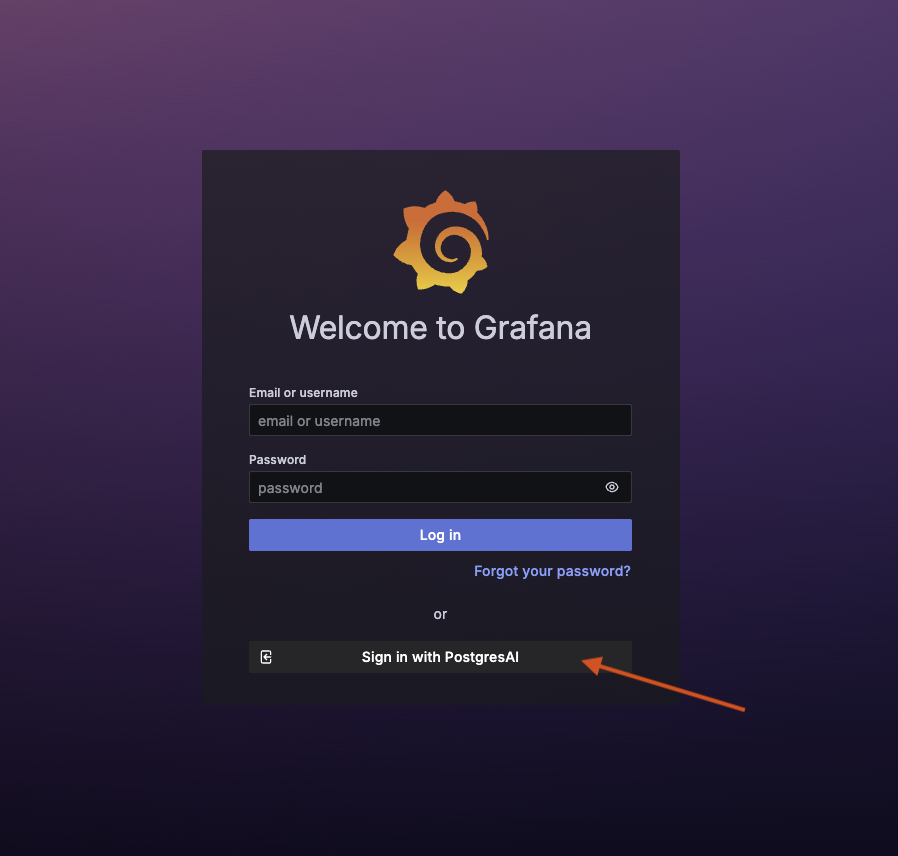
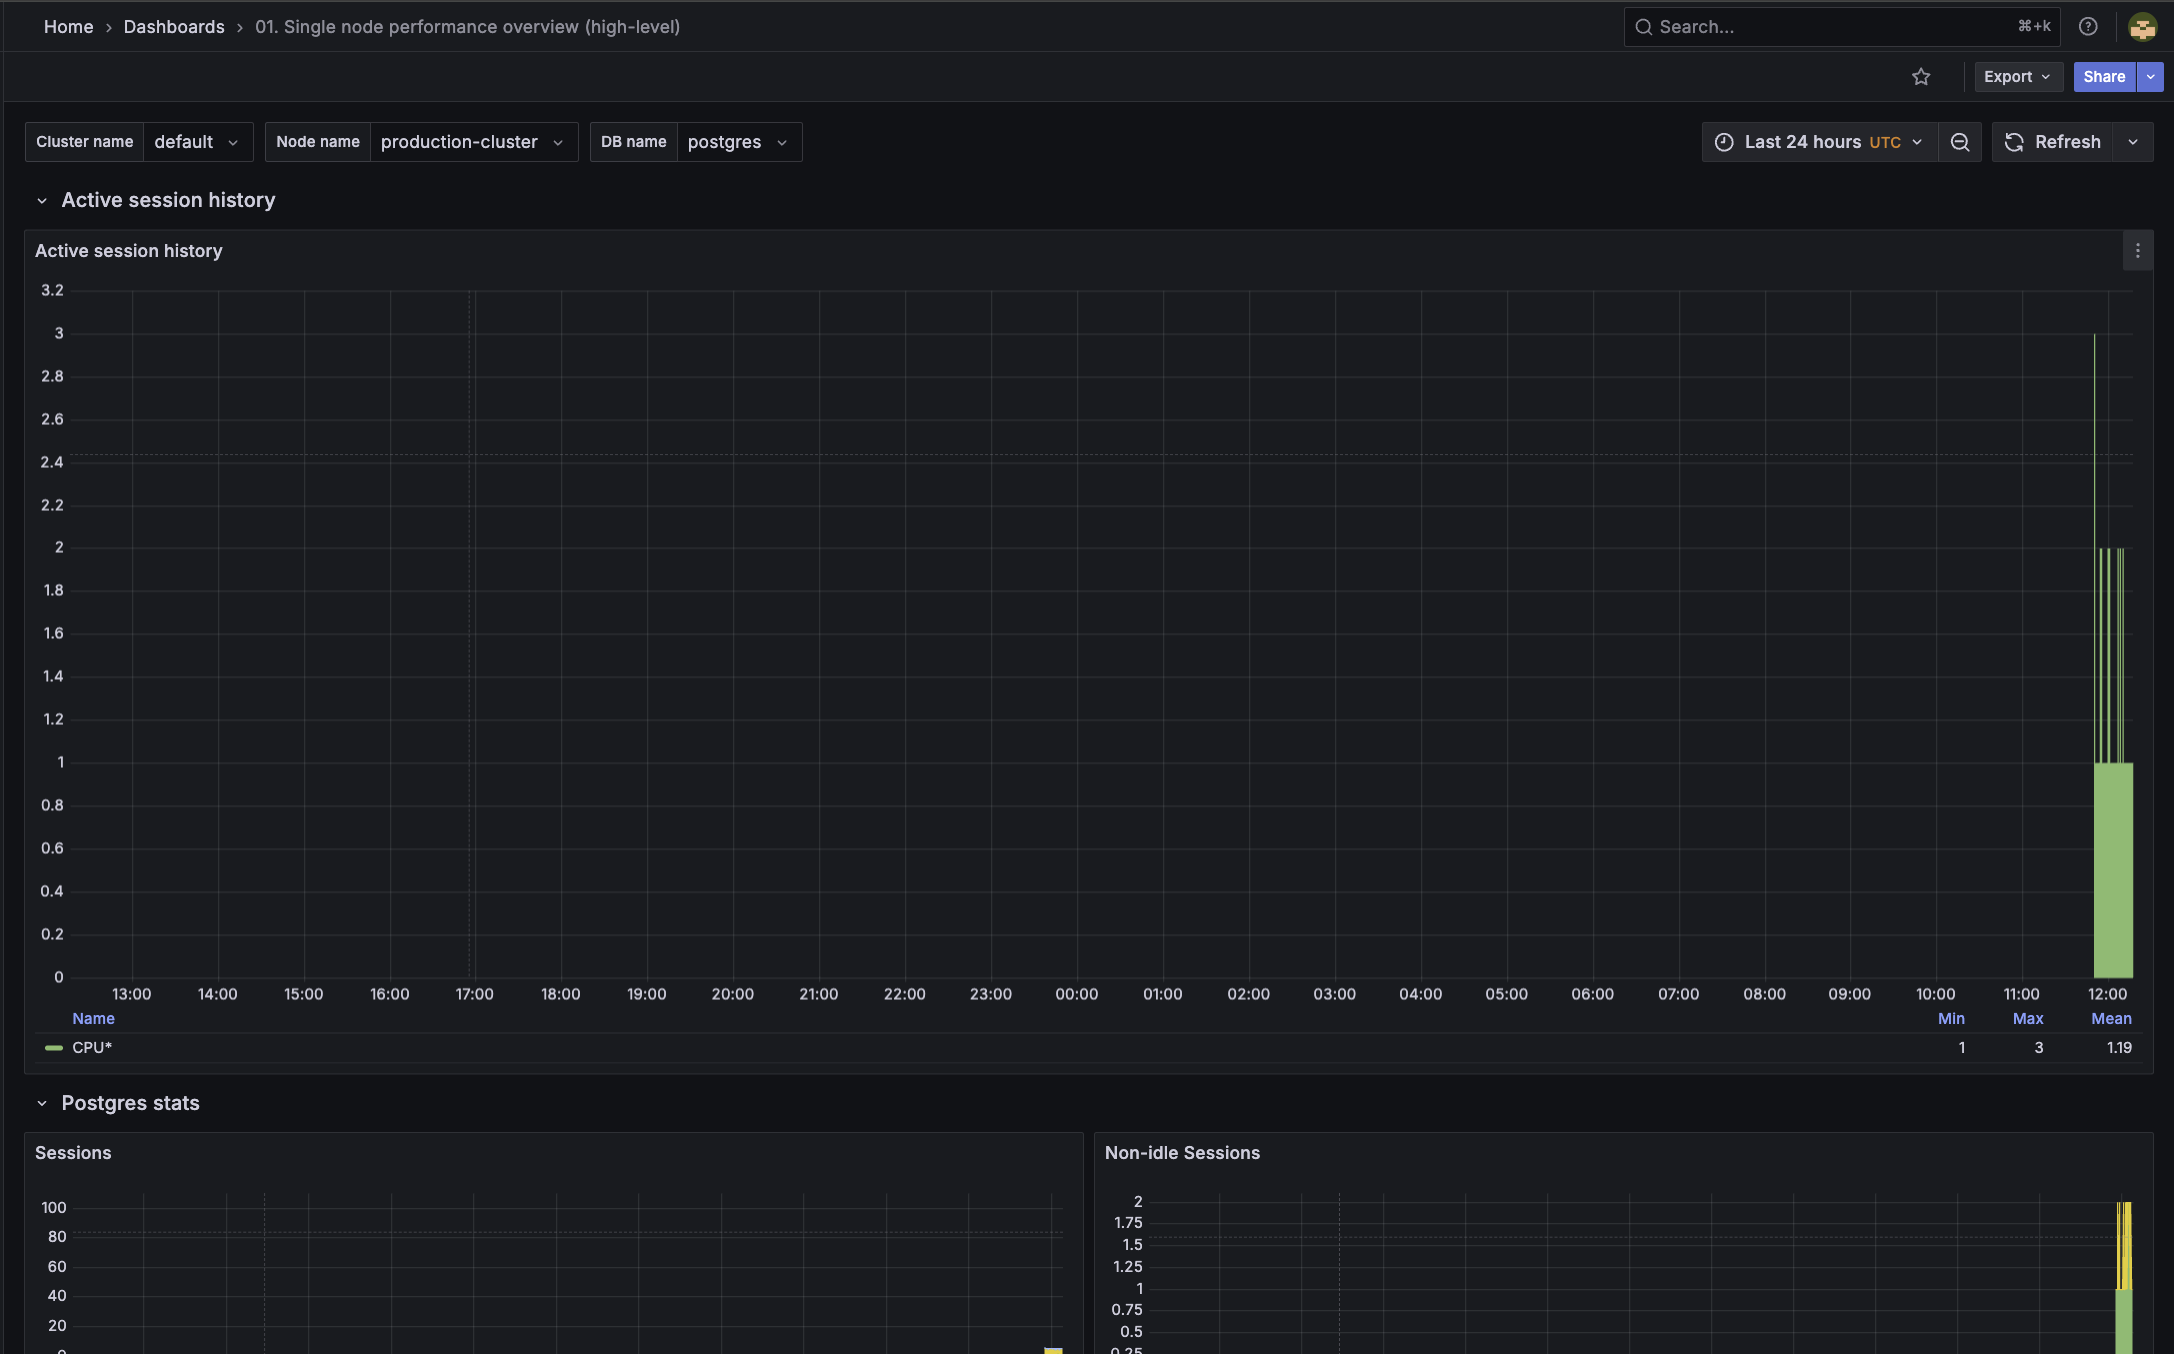
Open UI
Open the Grafana URL from After deployment (or from the instance page). You can sign in using one of the following methods:
- Grafana credentials: use the username and password shown in Grafana access after deployment.
- OAuth: click Sign in with PostgresAI.
If you choose OAuth, approve the access request by clicking Authorize.
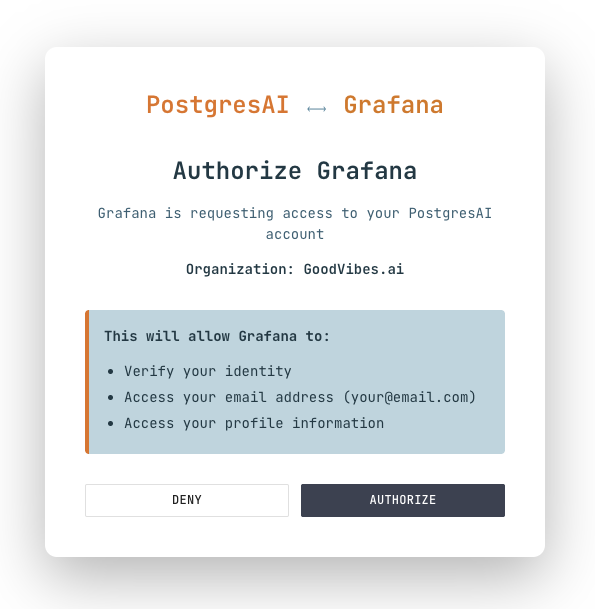
After authorization, you will be redirected to Grafana and can open dashboards.
Next steps
After about 30 minutes, your first issue reports will be generated. See How to work with issues to learn about managing issues, assigning team members, and integrating with AI coding tools.
Getting support
Guaranteed vendor support is included with PostgresAI monitoring — please use one of the available ways to contact.