10. Aggregated index analysis
Overview of index health, usage, and efficiency across all indexes.
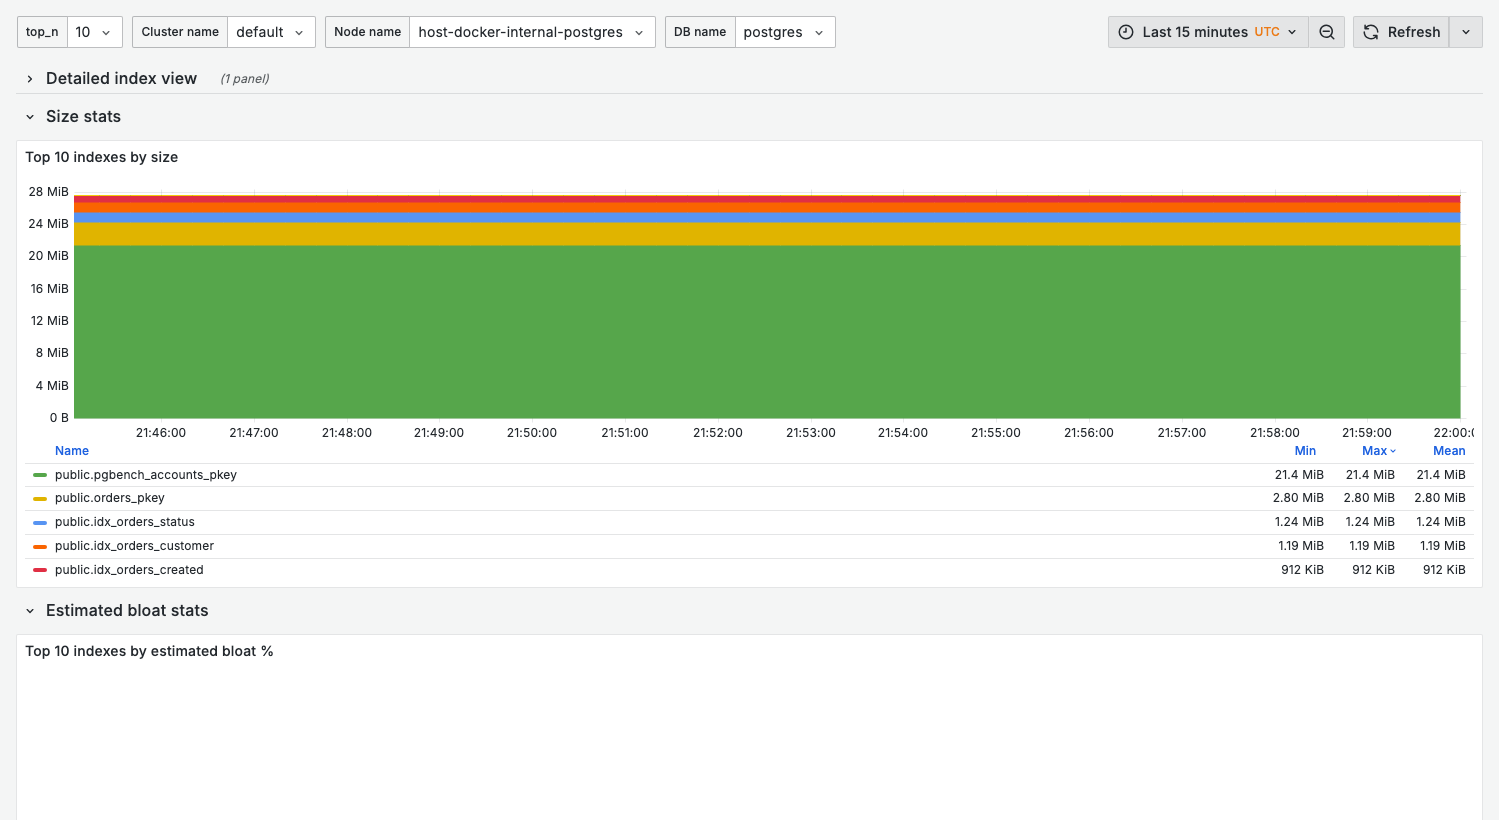
Index statistics require database activity and periodic stats collection. The screenshot shows available data from a demo environment; production systems with more indexes and query activity will show richer statistics.
Purpose
Identify indexes that need attention:
- Unused indexes wasting space and slowing writes
- Duplicate/redundant indexes
- Bloated indexes needing rebuild
- Missing indexes causing sequential scans
When to use
- Regular index health review
- Before/after adding new indexes
- Storage optimization
- Write performance tuning
Key panels
The dashboard opens with a Detailed index view table and is then organized into four rows of top-N panels: Size stats, Estimated bloat stats, Index usage stats, and IO stats.
Size stats
What it shows:
- Top $top_n indexes by size — the largest indexes
Use for:
- Spotting oversized indexes that dominate storage
The aggregated panels here show size, bloat, usage, and I/O — use them together with the Detailed index view table and a longer time range to find genuinely unused indexes. Before dropping any index, verify it isn't backing a unique constraint, a foreign key, or a periodic batch job, and drill into 11. Single index.
Estimated bloat stats
What it shows:
- Top $top_n indexes by estimated bloat % and by estimated bloat size
Index usage stats
What it shows:
- Top $top_n indexes by tuples read and by tuples fetched
Interpretation:
- Indexes with persistently zero tuples read over a long range are candidates for removal
IO stats
What it shows:
- Top $top_n indexes by block reads and by block hits
Variables
| Variable | Purpose |
|---|---|
top_n | Number of indexes to show in top-N panels (10, 15, 20, 50, 100) |
cluster_name | Cluster filter |
node_name | Node filter |
db_name | Database filter |
Per-index panels use topk($top_n, ...) to show only the highest-ranked indexes and drop the
long tail — they do not aggregate the remainder into a separate series. If the index you need is
not shown, raise top_n (or use 11. Single index).
See Top-N filtering.
Index analysis queries
Find unused indexes
select
  schemaname,
  relname as table_name,
  indexrelname as index_name,
  pg_size_pretty(pg_relation_size(indexrelid)) as index_size,
  idx_scan as scan_count
from pg_stat_user_indexes
where idx_scan = 0
  and indexrelname not like '%_pkey'
order by pg_relation_size(indexrelid) desc
limit 20;
Find duplicate indexes
select
  indrelid::regclass as table_name,
  array_agg(indexrelid::regclass) as duplicate_indexes
from pg_index
group by indrelid, indkey
having count(*) > 1;
Index usage statistics
select
  indexrelname,
  idx_scan,
  idx_tup_read,
  idx_tup_fetch,
  pg_size_pretty(pg_relation_size(indexrelid)) as size
from pg_stat_user_indexes
where relname = 'your_table'
order by idx_scan desc;
Index maintenance
Rebuild bloated index
-- Online rebuild (PostgreSQL 12+)
reindex index concurrently your_index;

-- Or create replacement and swap
create index concurrently your_index_new on your_table (column);
drop index your_index;
alter index your_index_new rename to your_index;
Check index health
-- Requires pgstattuple extension
select * from pgstattuple('your_index');
Related dashboards
- Single index deep-dive — 11. Single Index
- Table metrics — 08. Table Stats
- Query analysis — 02. Query Analysis
Troubleshooting
Index shows as unused but queries use it
-
Check stats were reset recently:
select stats_reset from pg_stat_database where datname = current_database(); -
Verify time range in dashboard covers query activity period
High index bloat
- Check table update patterns — frequent updates cause bloat
- Consider
reindex concurrentlyfor online rebuild - Review
maintenance_work_memsetting for vacuum efficiency