12. SLRU cache statistics
Monitor Simple LRU (SLRU) cache performance for PostgreSQL internal structures.
SLRU statistics require PostgreSQL 13+ and specific workload patterns to generate meaningful data. In low-activity environments, these panels may show minimal data.
Purpose
SLRU caches store critical PostgreSQL metadata:
- Transaction commit status (CLOG/pg_xact)
- Subtransaction data (pg_subtrans)
- Multixact data
- Serial/notify data
Poor SLRU performance can cause system-wide slowdowns.
When to use
- Investigating unexplained latency
- High wait events on SLRU-related locks
- Transaction ID wraparound preparation
- Performance tuning for high-concurrency workloads
Key panels
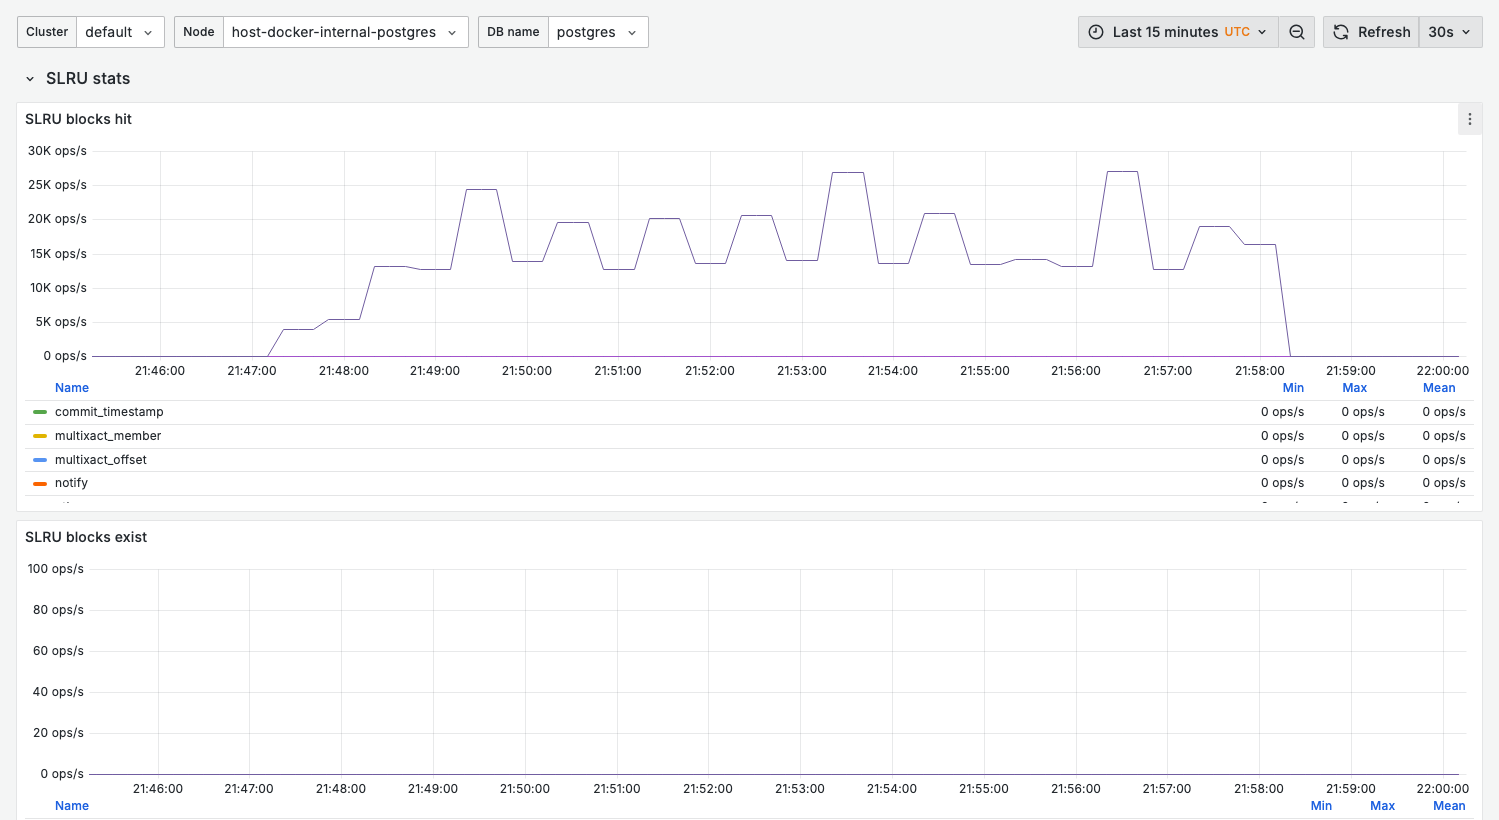
The dashboard's SLRU stats row has one panel per pg_stat_slru counter, each broken down by
cache type (name).
SLRU blocks hit
What it shows:
- Blocks served from each SLRU cache (cache hits)
- Higher relative to reads is better
Healthy range:
- Hits dominate reads for most caches
SLRU blocks exist
What it shows:
blks_exists— checks whether a block already exists in the cache
SLRU blocks read
What it shows:
- Blocks read into each SLRU cache from disk
- Breakdown by cache type
SLRU blocks written
What it shows:
- Write activity to SLRU caches
- High writes may indicate configuration issues
SLRU blocks zeroed
What it shows:
blks_zeroed— newly initialized (zeroed) SLRU pages
SLRU truncates / SLRU flushes
What it shows:
truncates— SLRU segment truncations (e.g. as old transaction data is removed)flushes— SLRU buffer flushes to disk
SLRU cache types
| Cache | Purpose | Tuning parameter |
|---|---|---|
CommitTs | Commit timestamps | track_commit_timestamp |
Xact | Transaction status (CLOG) | N/A (auto-managed) |
Subtrans | Subtransaction status | N/A |
MultiXact | Multixact mappings | N/A |
Notify | NOTIFY/LISTEN | max_notify_queue_pages |
Serial | Serializable isolation | N/A |
Variables
| Variable | Purpose |
|---|---|
cluster_name | Cluster filter |
node_name | Node filter |
db_name | Database filter |
SLRU statistics query
select
  name,
  blks_zeroed,
  blks_hit,
  blks_read,
  blks_written,
  blks_exists,
  flushes,
  truncates,
  round(100.0 * blks_hit / nullif(blks_hit + blks_read, 0), 2) as hit_ratio
from pg_stat_slru
order by blks_read desc;
Common issues
Low Xact cache hit ratio
Symptoms:
- Slow transaction commits
- High wait events on
XactBuffer
Causes:
- Long-running transactions
- Aggressive transaction ID consumption
- Transaction ID wraparound approaching
Solutions:
- Identify and terminate long transactions
- Schedule more frequent vacuums
- Consider connection pooling to reduce transaction overhead
High MultiXact activity
Symptoms:
- Slow
select for updateorfor share - High multiXact SLRU reads
Causes:
- Heavy use of row-level locking
- Many concurrent
for updatequeries
Solutions:
- Review application locking patterns
- Consider advisory locks for some use cases
Notify queue issues
Symptoms:
- NOTIFY/LISTEN delays
- High notify SLRU activity
Solutions:
- Increase
max_notify_queue_pagesif needed - Review NOTIFY usage patterns
Related dashboards
- Wait events — 04. Wait Events
- Node overview — 01. Node Overview
Troubleshooting
No SLRU data
SLRU statistics require PostgreSQL 13+. Check version:
select version();
Understanding SLRU impact
SLRU issues often manifest as:
LWLockwait events (in Dashboard 04)- Slow commit times
- Latency spikes during high concurrency
Correlate SLRU metrics with wait event data for diagnosis.