03. Single query deep-dive
Detailed analysis of a specific query identified by its queryid.
Purpose
When you've identified a problematic query in 02. Query analysis, use this dashboard to:
- Track query performance over time
- Identify regression patterns
- Analyze execution characteristics
- Compare before/after optimization
When to use
- After identifying a slow query in Dashboard 02
- Monitoring a specific query after adding an index
- Investigating intermittent query slowness
- Validating query optimization results
Key panels
Query text
A table at the top of the dashboard displays the full, non-truncated query text for the selected query_id.
The query shown uses parameter placeholders ($1, $2). For actual parameter values, check application logs.
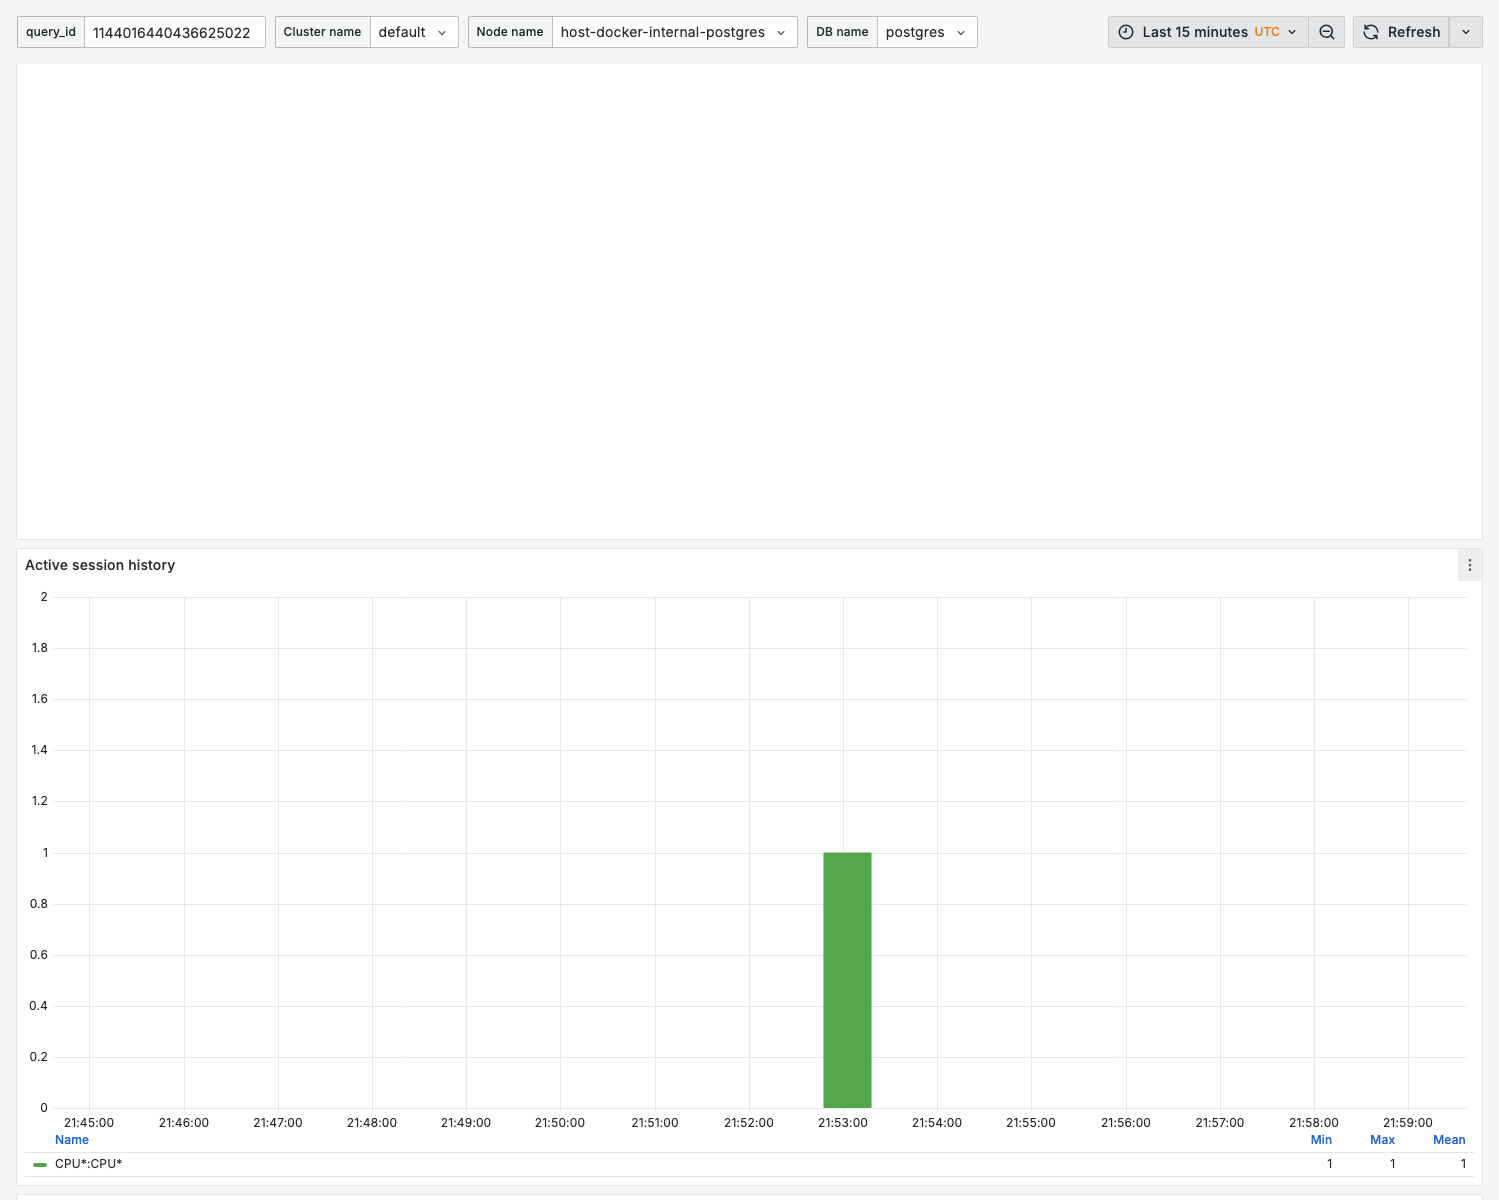
Active session history
What it shows:
- ASH-style breakdown of the wait events sampled for this
query_idover time
Use for:
- Seeing what this specific query spends its time waiting on (CPU, IO, locks, LWLocks)
Calls per second
What it shows:
- Execution frequency over time
- Trend and variability
Interpretation:
- Stable line = consistent application behavior
- Spikes = batch jobs or traffic bursts
- Drops = potential application issues
Execution time per call
What it shows:
- Average latency per execution
- Trend over selected time range
Healthy pattern:
- Consistent, low variance
- No upward trend
Warning signs:
- Upward trend = query regression (data growth, plan changes)
- High variance = parameter-dependent performance
- Step change = potential index drop or plan flip
Total execution time per second
What it shows:
- Combined load impact: calls × latency
- "Cost" to the database
Use for:
- Prioritizing optimization efforts
- Measuring optimization impact
Rows per call
What it shows:
- Average rows processed per execution
- Rows returned vs rows fetched
Interpretation:
- High rows fetched, low rows returned = inefficient filtering
- Growing over time = data growth impact
shared_blks_hit (in bytes)
What it shows:
- Shared buffer hits for this query (total and per call), expressed in bytes
- Cache efficiency for this query
Healthy state:
- High hit volume relative to physical reads for frequently accessed data
WAL and temp file usage
What it shows:
- WAL bytes and WAL fpi (full page images) generated by this query, total and per call
- Temp bytes read and written, total and per call
Use for:
- Spotting queries that generate excessive WAL (write amplification)
- Catching queries that spill to temp files (raise
work_mem)
Variables
| Variable | Purpose | How to Get |
|---|---|---|
query_id | Query identifier (textbox) | From Dashboard 02 or pg_stat_statements |
cluster_name | Cluster filter | Your cluster |
node_name | Node filter | Primary or replica |
db_name | Database filter | Database names or All |
Finding the query_id
From 02. Query analysis:
- Hover over a query in any chart
- Note the queryid from the legend (it populates the
query_idtextbox here)
From PostgreSQL directly:
select queryid, query, calls, mean_exec_time
from pg_stat_statements
where query like '%your_table%'
order by total_exec_time desc;
Example workflow
Investigating a slow query
- Identify: In Dashboard 02, find a query with high execution time per call
- Navigate: Copy the queryid, go to Dashboard 03
- Analyze timeline: Check if slowness is recent (regression) or historical
- Check rows: Compare rows fetched vs returned for indexing opportunities
- Monitor: After changes, verify improvement in this dashboard
Before/after optimization
- Note current metrics (mean time, rows)
- Add index or rewrite query
- Use time range selector to compare periods
- Verify improvement sustained over time
Related dashboards
- Find the query first — 02. Query analysis
- Check table statistics — 08. Table stats
- Verify index usage — 10. Index health
Troubleshooting
queryid not found
Possible causes:
- Query hasn't been executed recently
pg_stat_statementswas reset- Query text changed (different queryid)
Check if queryid exists:
select * from pg_stat_statements where queryid = YOUR_QUERYID;
Metrics show zero after index change
Adding an index may generate a new query plan with different characteristics. The queryid remains the same, but metrics reset if pg_stat_statements was cleared.
Inconsistent data
Some metrics are cumulative counters. Rate calculations depend on regular scraping. Gaps may occur if:
- Monitoring was temporarily stopped
- Network issues during scrape
- PostgreSQL was restarted
Use longer time ranges to smooth out anomalies.