13. Lock contention analysis
Monitor lock waits and identify blocking chains.
This dashboard only shows data when lock contention is occurring. In low-contention environments, panels will be empty. This is expected behavior — an empty dashboard indicates healthy lock performance.
Purpose
Diagnose lock-related performance issues:
- Identify blocking queries
- Find lock contention hotspots
- Analyze deadlock patterns
- Plan maintenance windows
When to use
- Applications experiencing lock timeout errors
- Queries waiting unexpectedly
- During DDL operations
- Investigating deadlocks
Key panels
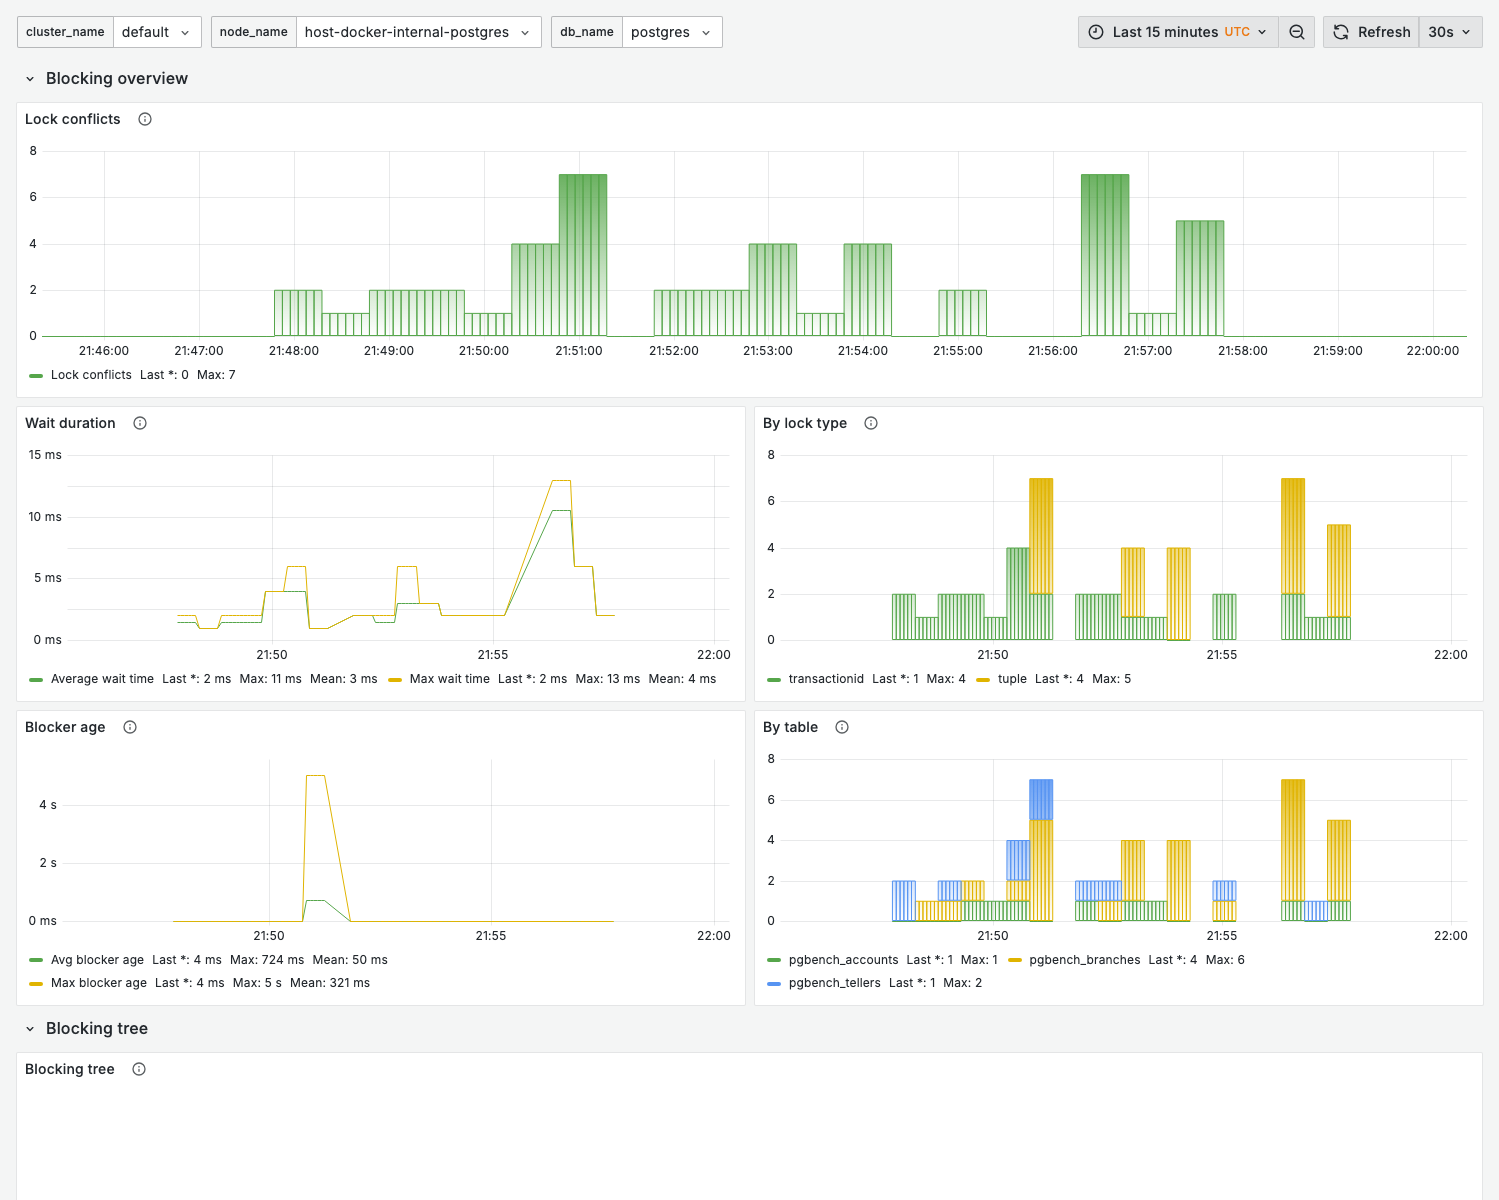
The dashboard has a Blocking overview row (five timeseries panels) and a Blocking tree row (one table).
Lock conflicts
What it shows:
- Number of lock-wait conflicts over time
Warning signs:
- Sustained conflicts
- Correlation with specific operations
Wait duration
What it shows:
- How long blocked backends have been waiting for locks (in ms)
By lock type
What it shows:
- Distribution of lock-wait conflicts by lock type
- Most common contention points
| Lock type | Description | Common cause |
|---|---|---|
RowExclusiveLock | Row modifications | UPDATE/DELETE conflicts |
AccessShareLock | SELECT operations | Long-running queries |
AccessExclusiveLock | DDL operations | ALTER TABLE, DROP |
ShareLock | Index creation | CREATE INDEX |
Blocker age
What it shows:
- Age of the blocking transaction (in ms) — how long the blocker has held its lock
By table
What it shows:
- Lock-wait conflicts broken down by the table being contended
Blocking tree
What it shows:
- A table view of the blocked/blocker relationships (the blocking chain), including the blocked and blocking PIDs
Interpretation:
- A single blocker affecting many rows — address that query
- Deep chains — potential design issue
Lock-wait metrics carry session PIDs
New in 0.15. The collected lock-wait metrics (the lock_waits metric group) now expose the
blocked and blocking backend PIDs as labels, so you can identify the blocker directly in
Grafana / PromQL without running the manual pg_locks join below.
Available labels include blocked_pid and blocker_pid, plus blocked_user / blocker_user,
blocked_appname / blocker_appname, blocked_table / blocker_table, and blocked_query_id /
blocker_query_id (plus datname). The two gauges are pgwatch_lock_waits_blocked_ms (how long
the blocked backend has waited) and pgwatch_lock_waits_blocker_tx_ms (age of the blocking
transaction). See the
monitoring reference.
# Longest current lock waits, labeled with blocker/blocked PIDs
topk(10, pgwatch_lock_waits_blocked_ms)
Because the blocker_pid is on the metric itself, you can read it straight off the panel and
terminate the blocker without any blocking-chain SQL:
select pg_terminate_backend(<blocker_pid>);
Variables
| Variable | Purpose |
|---|---|
cluster_name | Cluster filter |
node_name | Node filter |
db_name | Database filter |
Lock analysis queries
The queries below remain useful for ad-hoc investigation, but in 0.15 you no longer need them
just to find the blocking PID — it is available as the blocker_pid label on the lock-wait
metrics (see above).
Current lock waits
select
  blocked.pid as blocked_pid,
  blocked.query as blocked_query,
  blocking.pid as blocking_pid,
  blocking.query as blocking_query,
  now() - blocked.query_start as wait_duration
from pg_stat_activity as blocked
join pg_locks as blocked_locks
  on blocked.pid = blocked_locks.pid
join pg_locks as blocking_locks
  on blocked_locks.locktype = blocking_locks.locktype
  and blocked_locks.database is not distinct from blocking_locks.database
  and blocked_locks.relation is not distinct from blocking_locks.relation
  and blocked_locks.page is not distinct from blocking_locks.page
  and blocked_locks.tuple is not distinct from blocking_locks.tuple
  and blocked_locks.virtualxid is not distinct from blocking_locks.virtualxid
  and blocked_locks.transactionid is not distinct from blocking_locks.transactionid
  and blocked_locks.classid is not distinct from blocking_locks.classid
  and blocked_locks.objid is not distinct from blocking_locks.objid
  and blocked_locks.objsubid is not distinct from blocking_locks.objsubid
  and blocked_locks.pid != blocking_locks.pid
join pg_stat_activity as blocking
  on blocking_locks.pid = blocking.pid
where not blocked_locks.granted
order by wait_duration desc;
Lock statistics by table
select
  relname,
  mode,
  granted,
  count(*)
from pg_locks l
join pg_class c on l.relation = c.oid
where relnamespace = 'public'::regnamespace
group by relname, mode, granted
order by count(*) desc;
Recent deadlocks
Check PostgreSQL logs for deadlock entries, or use:
select
  datname,
  deadlocks
from pg_stat_database
where deadlocks > 0;
Resolving lock issues
Immediate actions
-
Identify the blocker:
select pid, query, state, wait_event
from pg_stat_activity
where pid in (select pid from pg_locks where not granted); -
Terminate if necessary (use the
blocker_pidlabel from the lock-wait metric, or theblocking_pidfrom the query above):select pg_terminate_backend(<blocker_pid>);
Preventive measures
| Issue | Solution |
|---|---|
| Long transactions | Set idle_in_transaction_session_timeout |
| DDL during traffic | Use lock_timeout, schedule maintenance |
| Hot row contention | Review application design |
| Deadlocks | Consistent lock ordering in application |
Related dashboards
- Wait events — 04. Wait Events
- Query analysis — 02. Query Analysis
- Node overview — 01. Node Overview
Troubleshooting
No lock data shown
- Verify there are actual lock waits occurring
- Check time range — lock waits may be brief
Frequent deadlocks
- Review application transaction patterns
- Ensure consistent lock ordering
- Consider advisory locks for complex scenarios
- Check for missing indexes causing full table locks