04. Wait event analysis (Active Session History)
Active Session History (ASH) style dashboard for deep wait event analysis.
ASH by wait type
ASH by wait event
ASH by query
Purpose
Similar to AWS RDS Performance Insights or Oracle ASH, this dashboard provides:
- Detailed breakdown of what sessions are waiting on
- Historical wait event patterns
- Correlation between waits and performance issues
When to use
- Database is slow but CPU is not high
- Investigating lock contention
- Understanding I/O patterns
- Diagnosing intermittent slowdowns
Prerequisites
This dashboard uses wait event data collected from pg_stat_activity by pgwatch. No additional extensions are required.
Key panels
The dashboard has three panels, each an Active Session History view at a different level of detail:
Active session history (grouped by wait event type), Active session history by event type
(adds the specific wait event), and Active session history by event type and event (further
broken down per query_id).
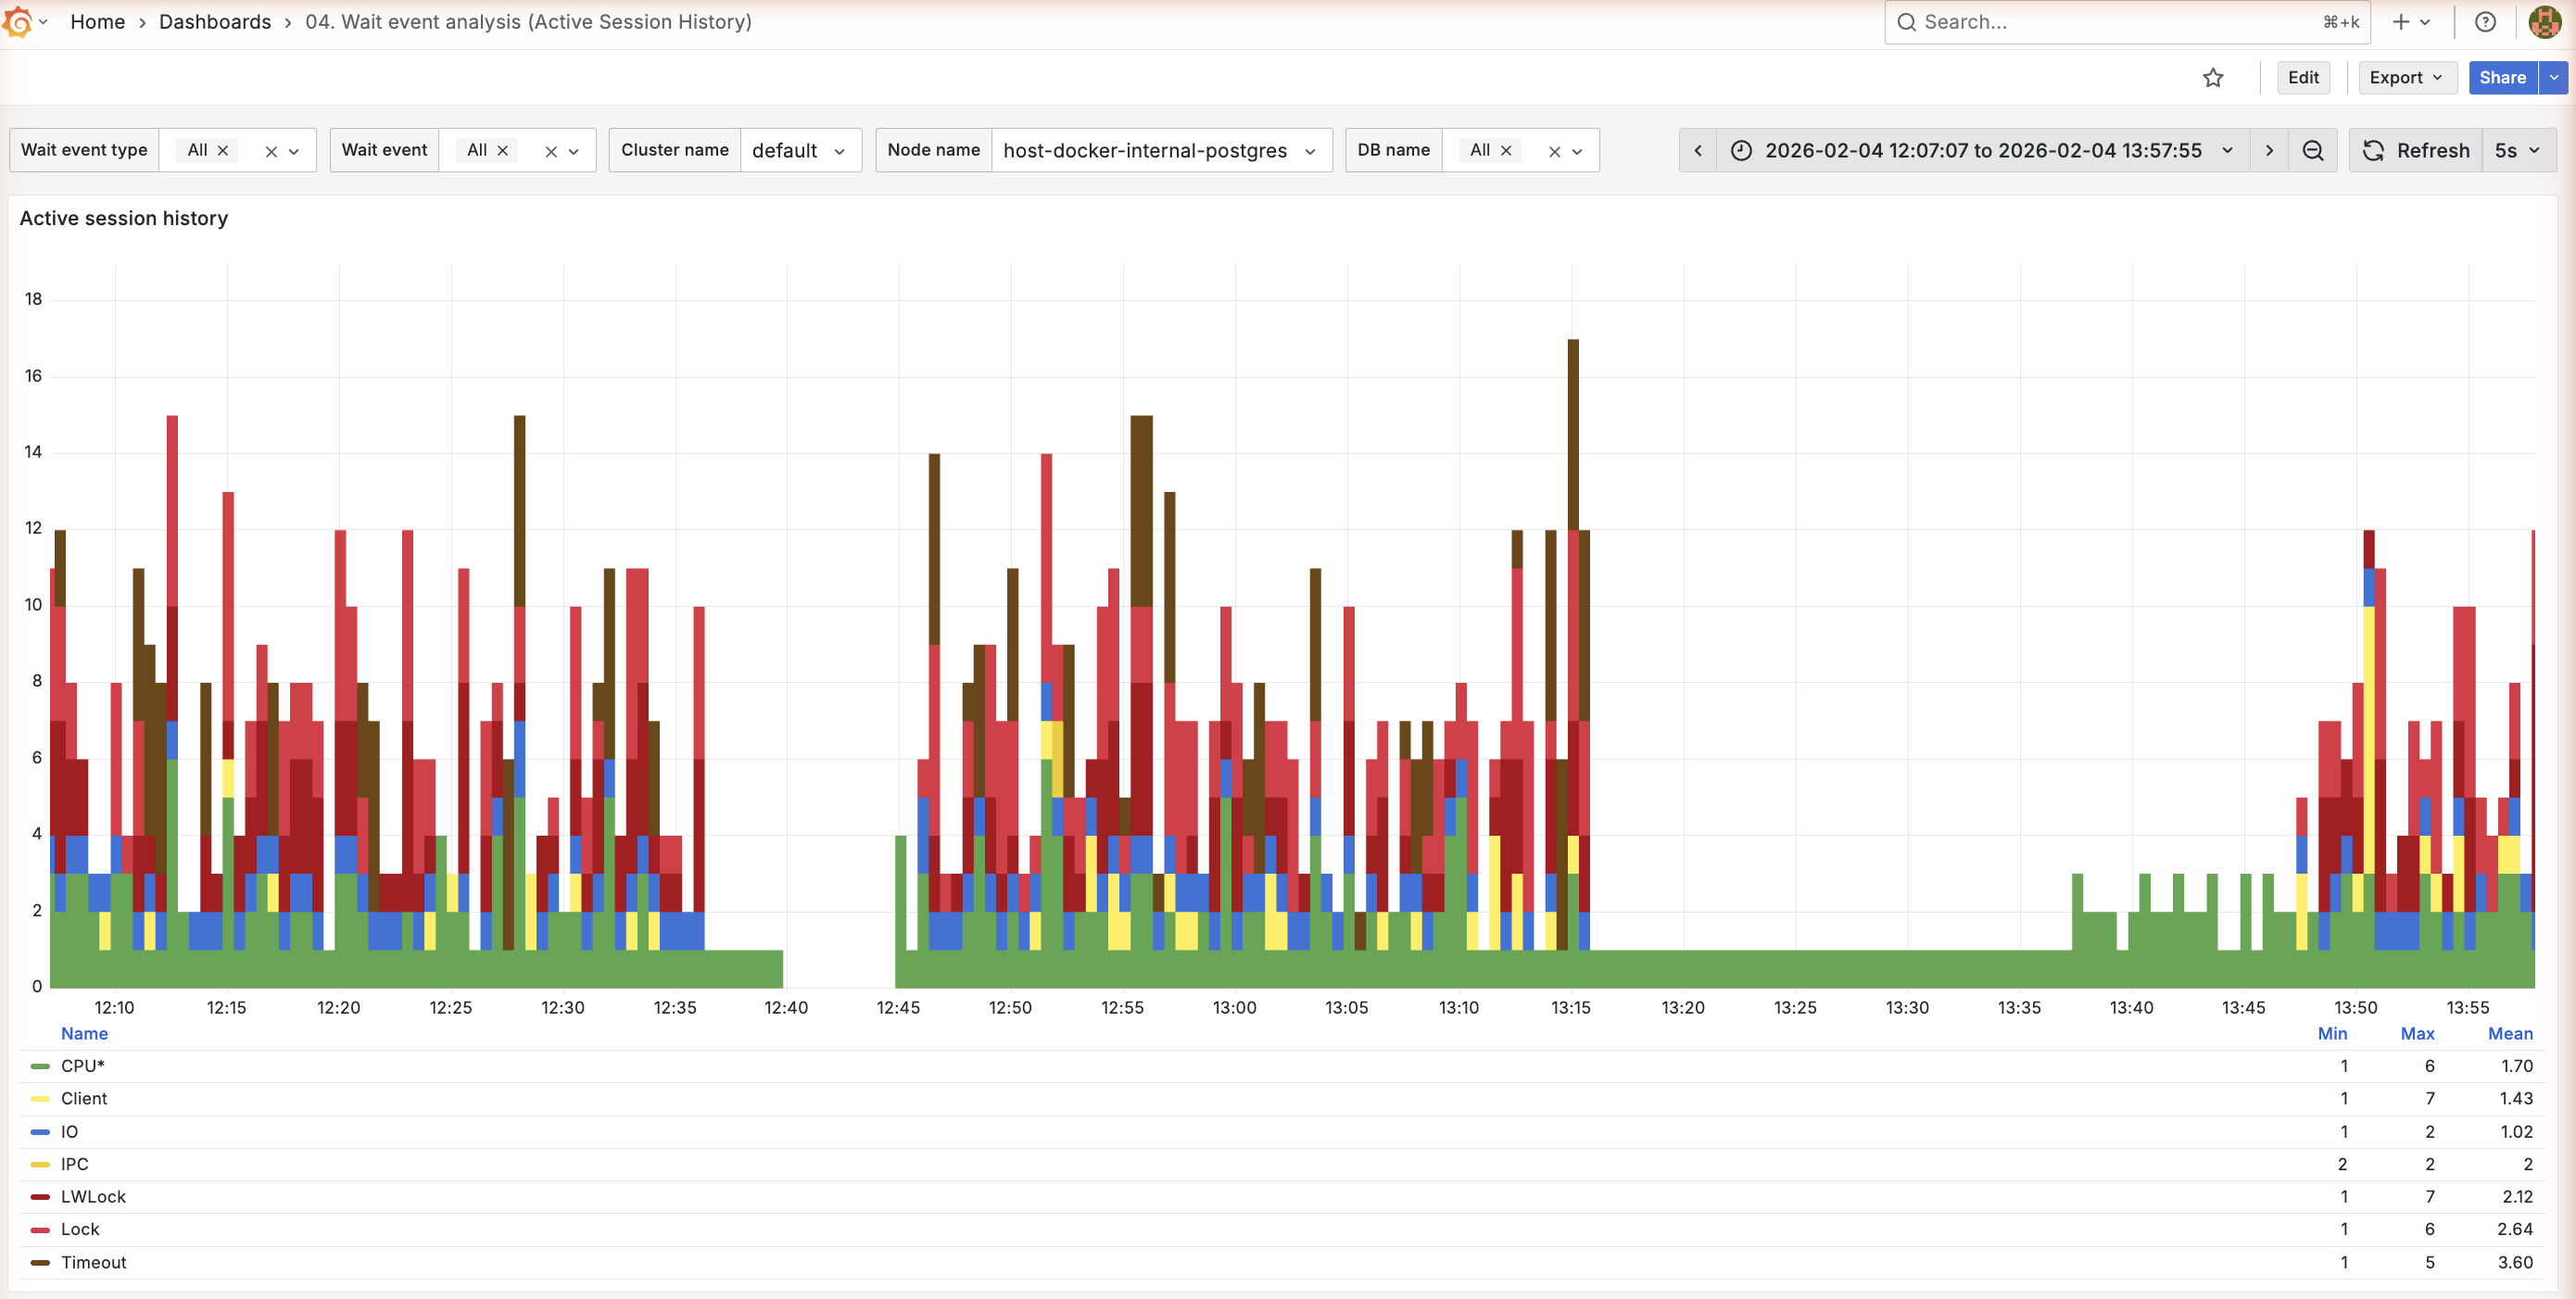
Active session history
What it shows:
- Stacked bar chart of active sessions by wait event type over time
- Each color represents a wait event type
Wait event categories:
| Category | Description | Common events |
|---|---|---|
| CPU | On-CPU processing | CPU* |
| IO | Disk I/O operations | DataFileRead, WALWrite |
| LWLock | Internal PostgreSQL locks | BufferContent, LockManager |
| Lock | Row/table locks | tuple, transactionid |
| BufferPin | Buffer pinning | BufferPin |
| Activity | Background processes | LogicalLauncherMain |
| IPC | Inter-process communication | BgWorkerStartup |
Interpretation guide for the most common wait events you will see in these panels:
| Wait event | Meaning | Action |
|---|---|---|
CPU* | Query processing | Normal if workload-appropriate |
DataFileRead | Reading from disk | Check shared_buffers, add memory |
DataFileWrite | Writing to disk | Normal for writes |
WALWrite | WAL I/O | Check storage speed |
LWLock:BufferContent | Buffer contention | Scale up, partition tables, reduce bloat |
Lock:tuple | Row lock wait | Check for lock conflicts |
Lock:transactionid | Transaction wait | Long transactions blocking |
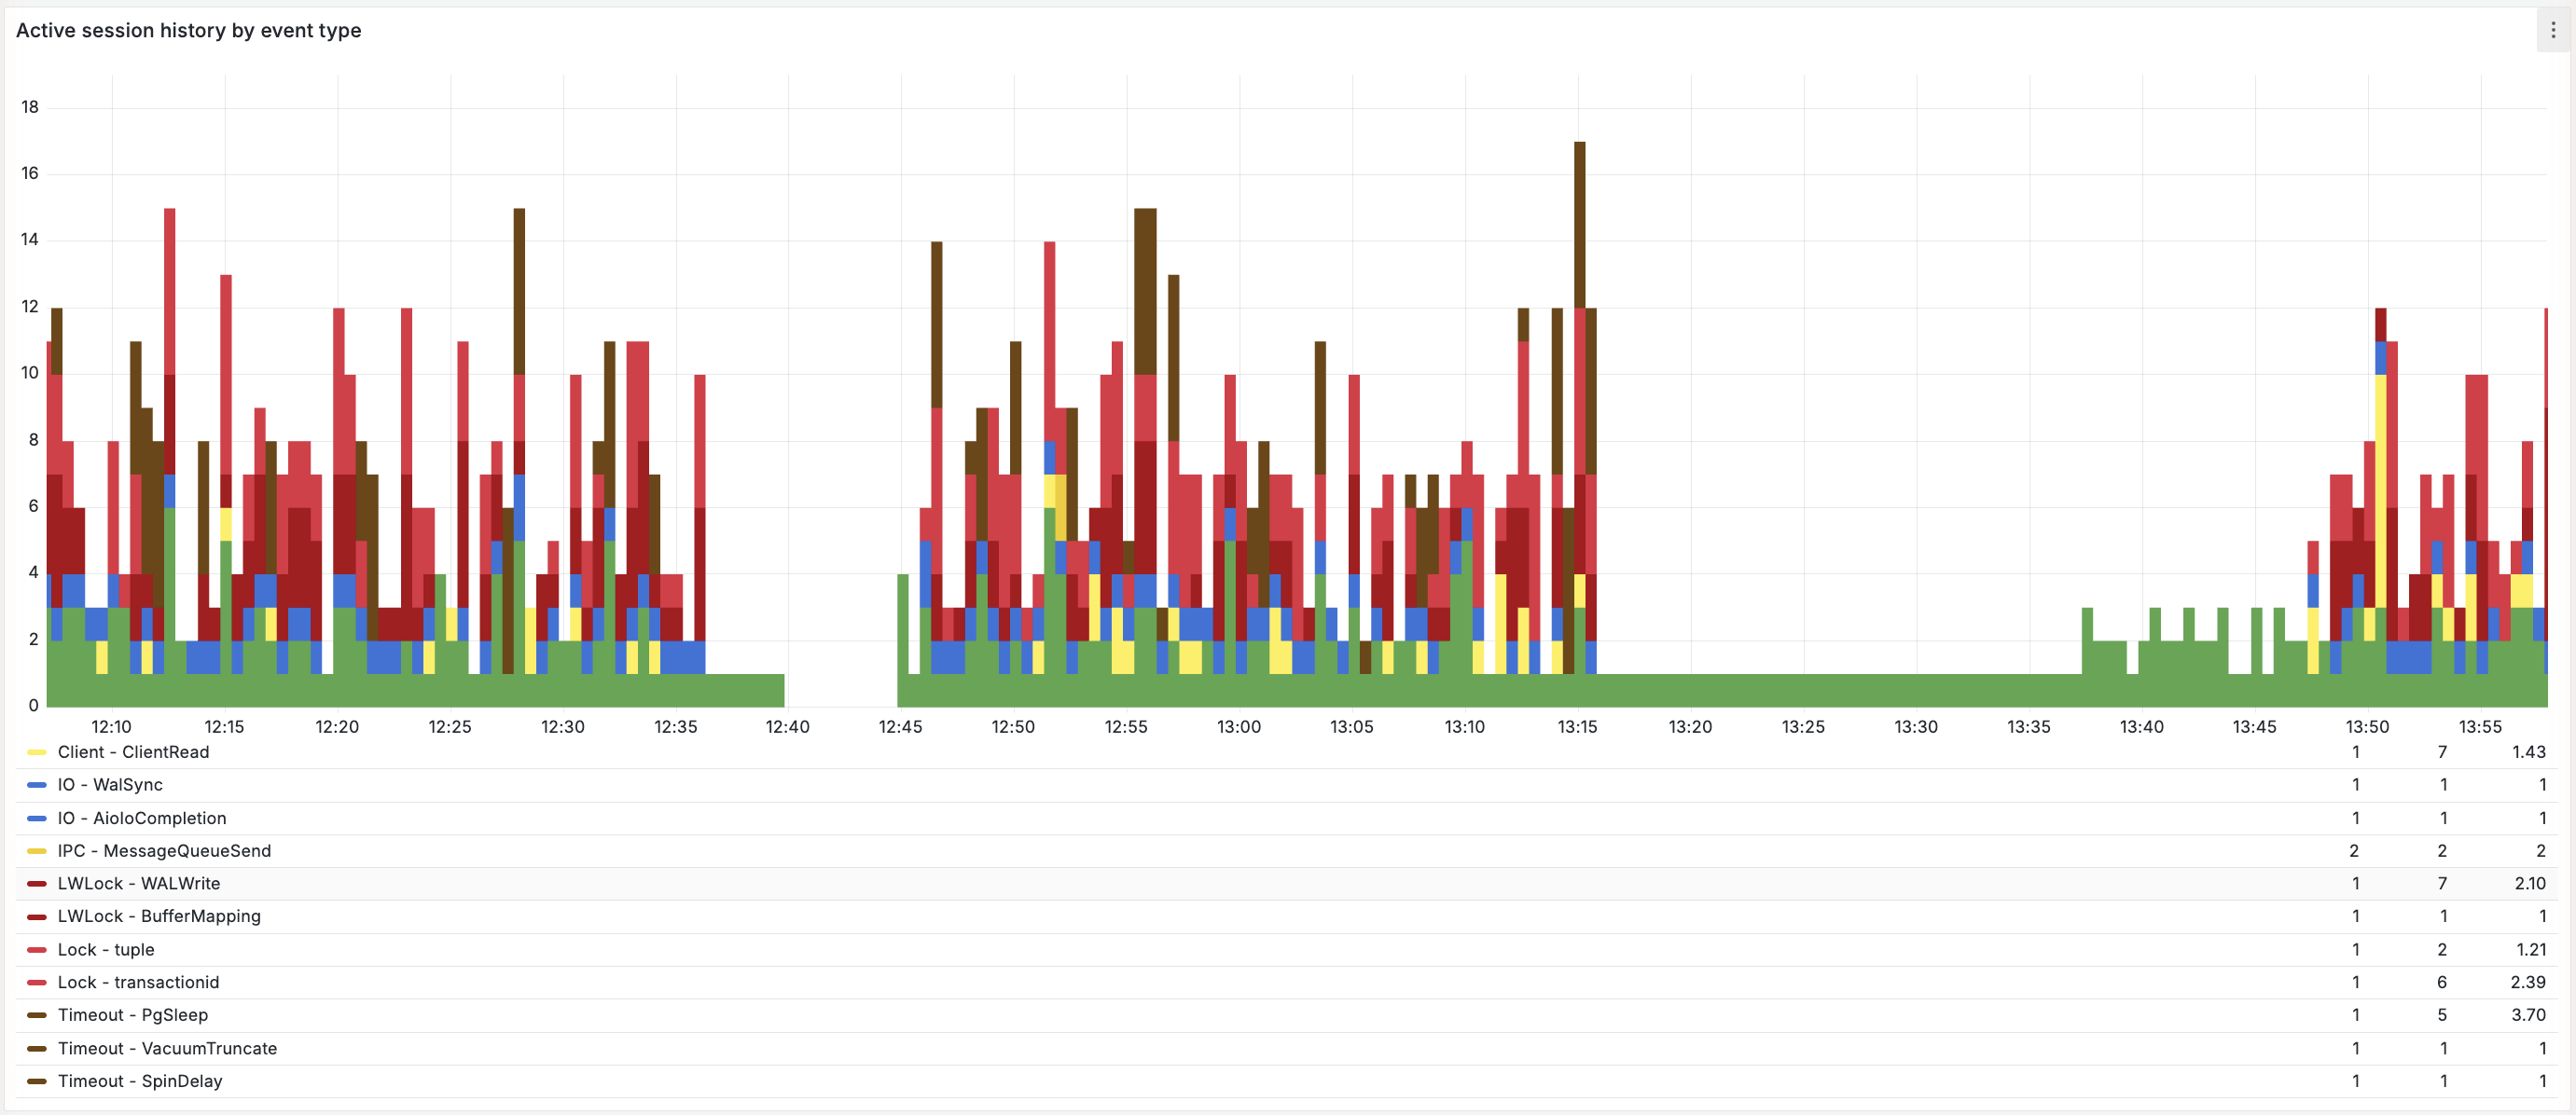
Active session history by event type
What it shows:
- The same ASH view, additionally split out by the specific wait event (
wait_event) within each type, so you can see exactly which event dominates a wait type
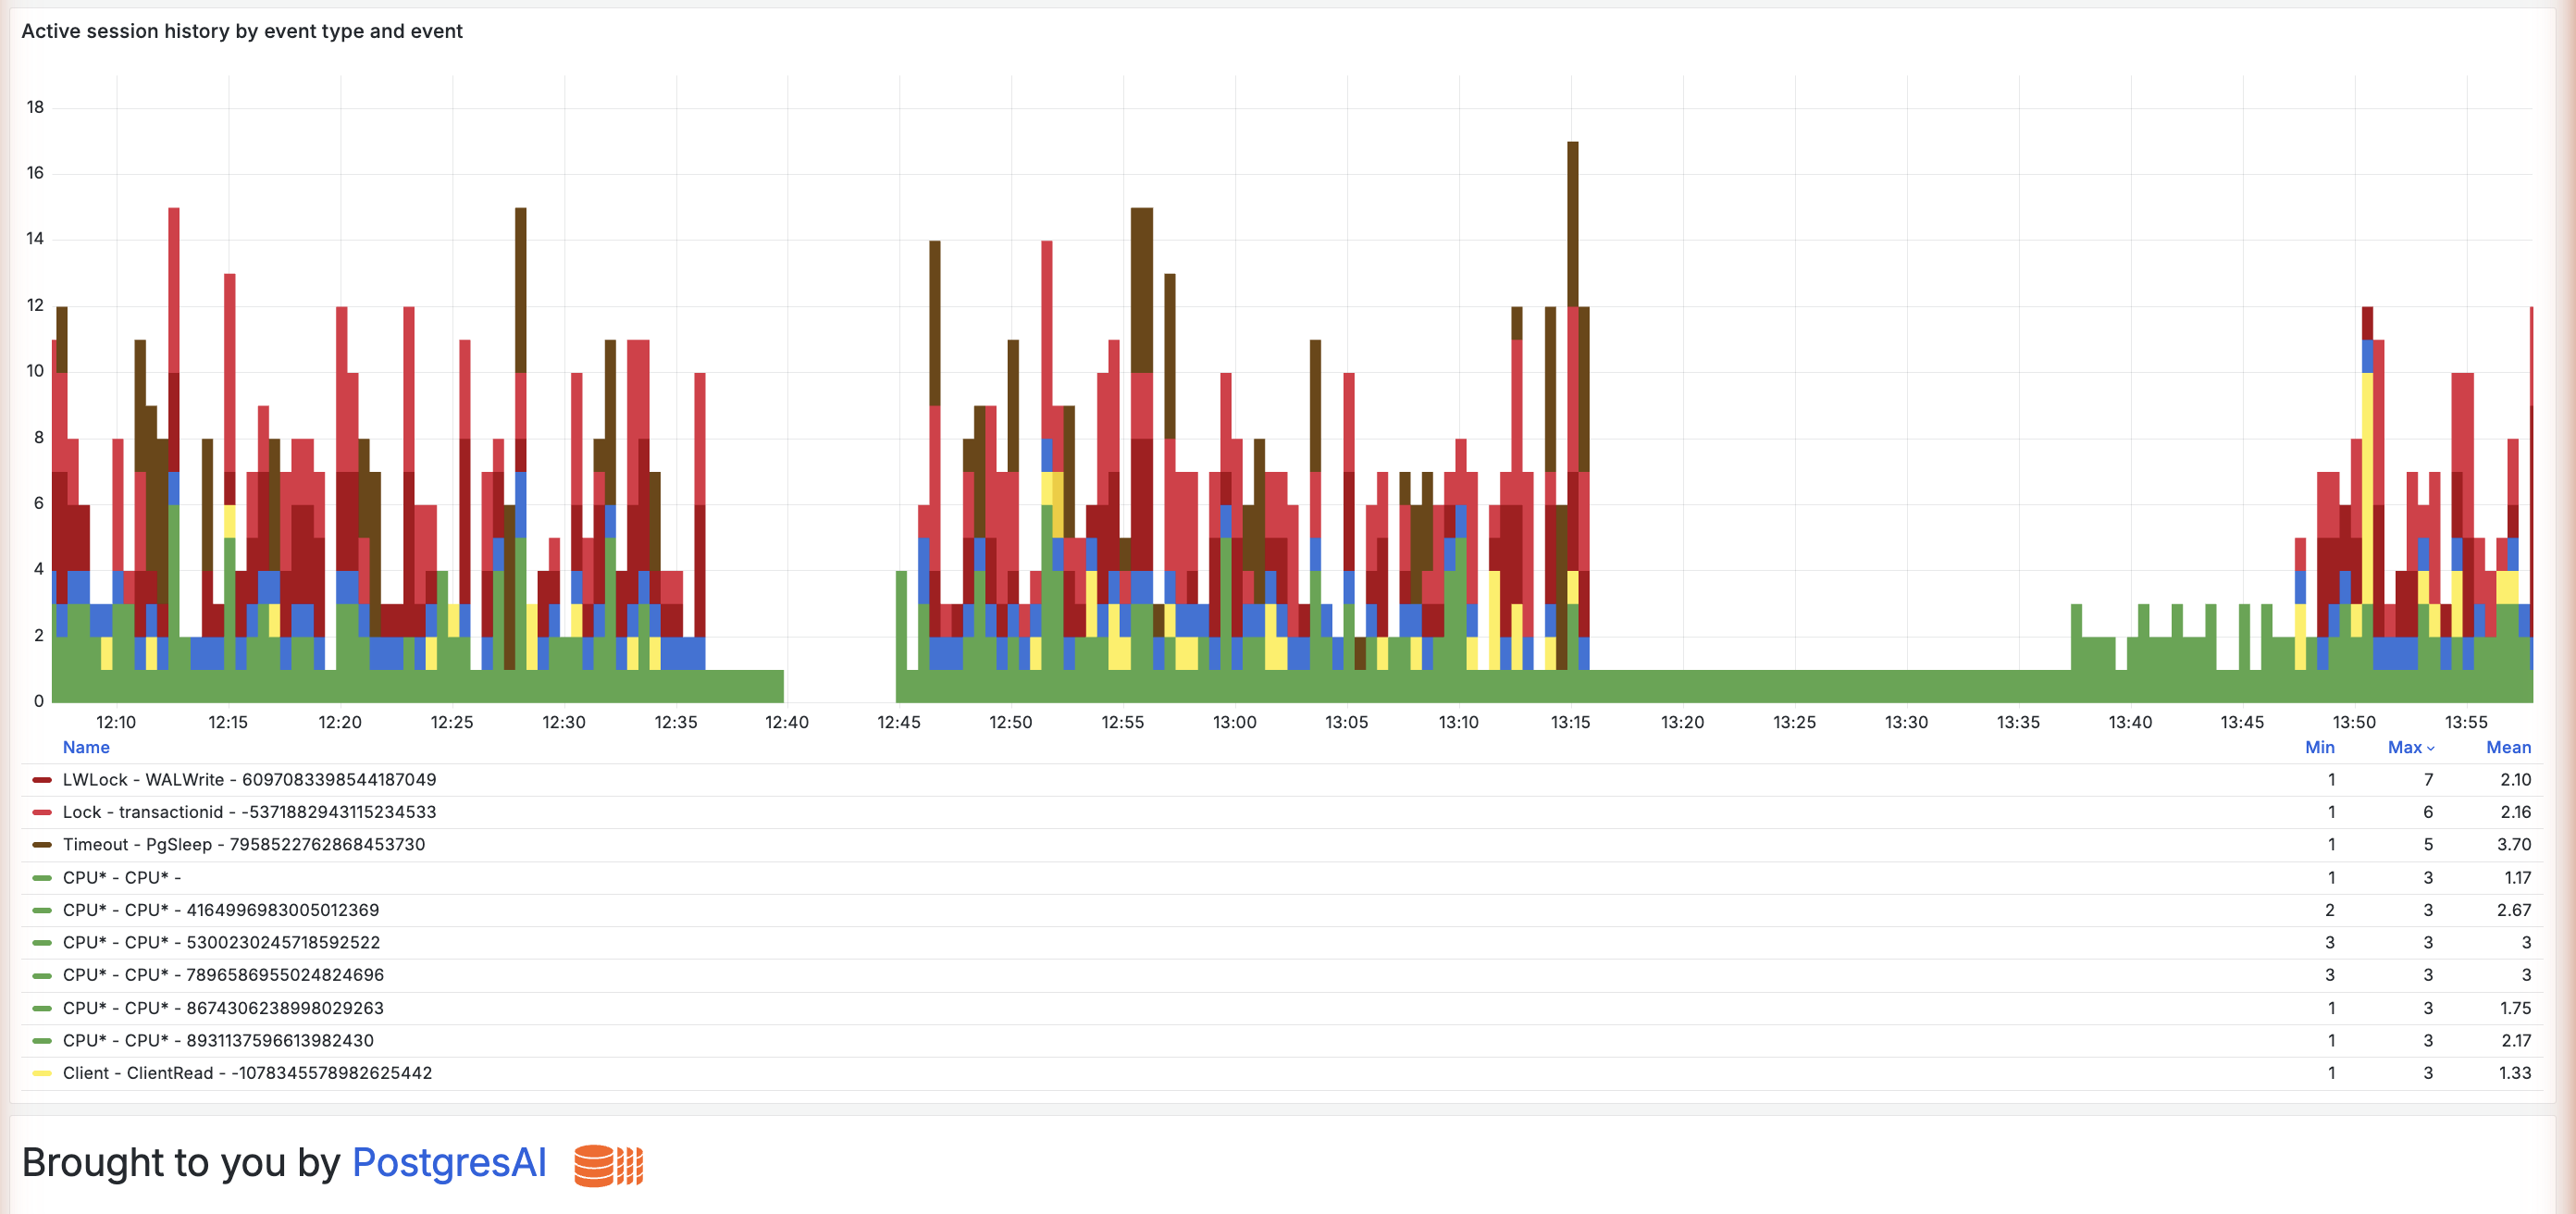
Active session history by event type and event
What it shows:
- The ASH view further attributed to the
query_idresponsible, linking waits to specific queries (when captured during sampling)
Limitations:
- Only captures queries active during sampling
- Short queries may be missed
- Use with 02. Query analysis for complete picture
Understanding wait events
CPU waits
High CPU wait is normal for compute-bound workloads. Investigate if:
- CPU wait is disproportionate to actual CPU usage
- Query throughput is lower than expected
I/O waits
Common I/O wait events:
| Event | Cause | Solution |
|---|---|---|
DataFileRead | Reading data not in cache | Increase shared_buffers, add indexes |
DataFileExtend | Growing data files | Pre-extend files, faster storage |
DataFileFlush | Flushing dirty pages | Tune checkpoint_* settings |
WALSync | Syncing WAL | Faster WAL storage, adjust commit_delay |
Lock waits
Lock wait events indicate heavyweight lock contention:
| Event | Cause | Solution |
|---|---|---|
Lock:tuple | Row-level lock wait | Avoid multiple sessions modifying same rows; use FOR UPDATE SKIP LOCKED or NOWAIT |
Lock:transactionid | Waiting for transaction | Find and address long transactions |
Lock:relation | Table-level lock | Use low lock_timeout with retries for DDL. See Zero-downtime schema migrations |
LWLock waits
Lightweight locks are internal to PostgreSQL:
| Event | Cause | Solution |
|---|---|---|
LWLock:BufferContent | Concurrent access to same buffer page | Scale up instance, partition tables, reduce foreign keys, address bloat with VACUUM FULL or pg_repack |
LWLock:LockManager | Fast-path lock limit exceeded (16 locks/backend) | Enable partition pruning, reduce indexes, use connection pooler. See Postgres Marathon series |
Variables
| Variable | Purpose |
|---|---|
wait_event_type | Filter by wait event type |
wait_event | Filter by specific wait event |
cluster_name | Cluster filter |
node_name | Node filter |
db_name | Database filter |
Related dashboards
- Overview — 01. Node overview
- Lock details — 13. Lock contention
- Query correlation — 02. Query analysis
Troubleshooting
No wait event data
-
Verify pgwatch is collecting metrics:
docker compose logs pgwatch-postgres pgwatch-prometheus | grep -i wait -
Check VictoriaMetrics has wait event data (host port
59090, VM basic auth):curl -u "$VM_AUTH_USERNAME:$VM_AUTH_PASSWORD" \
'http://localhost:59090/api/v1/query?query=pgwatch_wait_events_total' -
Ensure
pg_stat_activityis accessible to the monitoring user
Wait events don't match RDS Performance Insights
Different collection mechanisms and methodologies may cause variations. PostgresAI monitoring does
not use a sub-second sampler. Instead, the wait_events metric is a snapshot count(*) of active
sessions in pg_stat_activity (WHERE state = 'active'), grouped by wait_event_type /
wait_event. This snapshot is collected on the metric interval — every 15 seconds in the full
preset — and then aggregated into time buckets for visualization.
RDS Performance Insights samples at a higher frequency (roughly once per second), so absolute counts and short-lived waits can differ.
"Other" category too large
The "Other" category contains infrequent or miscellaneous waits. If large:
- Check for uncommon extensions
- Review background worker activity
- Consider if sampling rate is appropriate