Self-monitoring dashboard
Monitor the health of the monitoring stack itself.
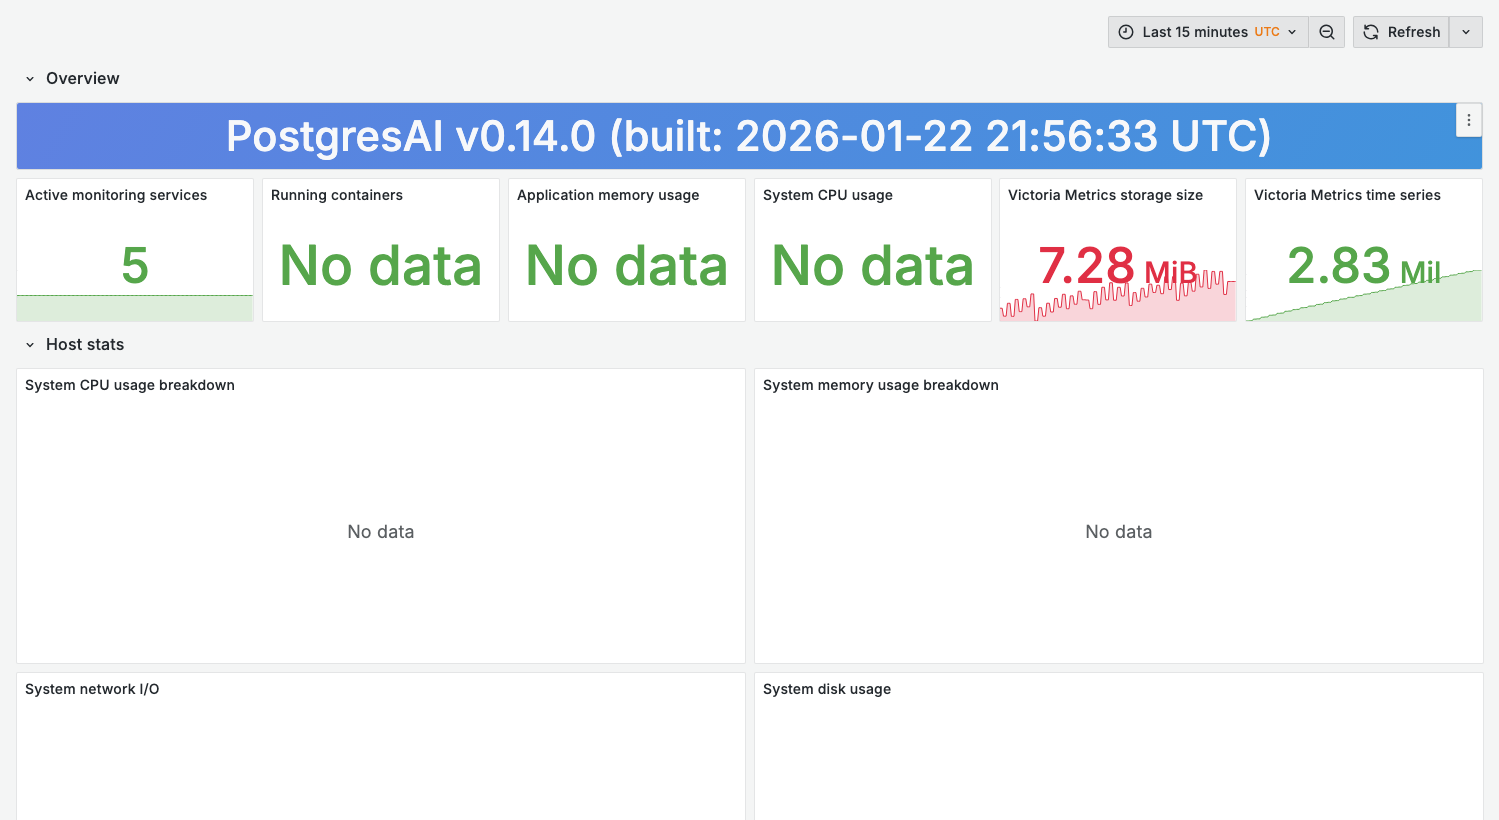
The screenshot shows a containerized demo environment. Some host-level panels (CPU, memory, disk, network) require node_exporter or cAdvisor with Docker socket access. In production environments with proper host metrics collection, all panels display data.
Purpose
Ensure the monitoring infrastructure is functioning correctly:
- Metrics collection is working
- Storage has capacity
- No data gaps
- Alert pipeline is healthy
When to use
- Regular monitoring stack health checks
- After monitoring stack updates
- When dashboards show "No data"
- Capacity planning for monitoring infrastructure
Key panels
The dashboard is organized into six rows: Overview, Host stats, Disk I/O metrics, Container resource usage, Victoria Metrics metrics, and Sink Postgres database.
Overview
What it shows (single-stat tiles):
- Active monitoring services and Running containers
- Application memory usage and System CPU usage
- Victoria Metrics storage size and Victoria Metrics time series
Host stats and Disk I/O metrics
What it shows:
- System CPU / memory / network / disk usage breakdowns
- Disk I/O operations (IOPS), throughput, utilization, and average latency
Container resource usage
What it shows:
- Per-container CPU, memory, network I/O, and disk I/O
Victoria Metrics metrics
What it shows:
- Victoria Metrics ingestion rate — samples ingested per second
- Scrape duration by target — how long each scrape takes (rising durations = a target is slow)
- Victoria Metrics storage size — disk usage; project capacity against your retention
- Victoria Metrics rows count — number of stored rows; watch for cardinality explosion
Sink Postgres database
What it shows:
- Sink Postgres connections, transactions, database size, and block I/O
Variables
This dashboard has no template variables — it reports on the monitoring stack itself (Grafana, VictoriaMetrics, the sink Postgres, cAdvisor, and node-exporter), which is a single instance, so there is nothing to filter by cluster or node.
Health check commands
The VictoriaMetrics API on host port 59090 requires basic auth in 0.15. Every curl below passes
-u "$VM_AUTH_USERNAME:$VM_AUTH_PASSWORD"; export those from your stack's .env first (or substitute
the values). Without credentials these endpoints return 401 Unauthorized.
Check VictoriaMetrics status
curl -u "$VM_AUTH_USERNAME:$VM_AUTH_PASSWORD" \
  http://localhost:59090/api/v1/status/tsdb
Check pgwatch status
docker compose logs pgwatch-postgres pgwatch-prometheus --tail=50
Check Prometheus/VM targets
curl -u "$VM_AUTH_USERNAME:$VM_AUTH_PASSWORD" \
  http://localhost:59090/api/v1/targets
Verify metrics collection
curl -u "$VM_AUTH_USERNAME:$VM_AUTH_PASSWORD" \
  'http://localhost:59090/api/v1/query?query=up'
Common issues
Dashboards show "No data"
-
Check scrape targets are up:
curl -u "$VM_AUTH_USERNAME:$VM_AUTH_PASSWORD" \
http://localhost:59090/api/v1/targets | jq '.data.activeTargets[] | {job: .labels.job, health: .health}' -
Verify metric exists:
curl -u "$VM_AUTH_USERNAME:$VM_AUTH_PASSWORD" \
'http://localhost:59090/api/v1/label/__name__/values' | jq '.data[]' | grep pg_ -
Check time range alignment
High storage growth
-
Check for cardinality explosion:
curl -u "$VM_AUTH_USERNAME:$VM_AUTH_PASSWORD" \
'http://localhost:59090/api/v1/status/tsdb' | jq '.data.totalSeries' -
Review high-cardinality metrics:
curl -u "$VM_AUTH_USERNAME:$VM_AUTH_PASSWORD" \
'http://localhost:59090/api/v1/status/tsdb' | jq '.data.seriesCountByMetricName | to_entries | sort_by(-.value) | .[0:10]' -
Adjust retention if needed (default is
336h≡ 14 days):# docker-compose.yml
sink-prometheus:
environment:
- VM_RETENTION_PERIOD=30d # Adjust retention if needed
Scrape timeouts
-
Increase scrape timeout:
# prometheus.yml
scrape_configs:
  - job_name: 'pgwatch-prometheus'
scrape_timeout: 30s -
Check target database performance
-
Review pgwatch resource allocation
Capacity planning
Estimating storage needs
| Factor | Impact |
|---|---|
| Number of databases | Linear increase |
| Scrape interval | Shorter = more data |
| Retention period | Longer = more storage |
| Query cardinality | High = more series |
Formula:
Daily storage ≈ (series_count × samples_per_day × bytes_per_sample) / compression_ratio
Typical values:
- Bytes per sample: ~2-4 (compressed)
- Compression ratio: 10-15x
- Samples per day at the default 30s interval: ~2,880 (most metric groups collect every 30s;
pg_stat_activityandwait_eventsevery 15s)
Scaling recommendations
| Databases | Recommended resources |
|---|---|
| 1-5 | 2 CPU, 2 GiB RAM, 20 GiB disk |
| 5-20 | 4 CPU, 4 GiB RAM, 100 GiB disk |
| 20-50 | 8 CPU, 8 GiB RAM, 500 GiB disk |
Related dashboards
- Target database health — 01. Node Overview