08. Aggregated table analysis
Overview of table-level metrics across all tables in the database.
Purpose
Identify tables that need attention:
- High sequential scan rates
- Bloat accumulation
- Dead tuple buildup
- HOT update efficiency
When to use
- Routine table health review
- Finding indexing opportunities
- Capacity planning
- Identifying maintenance candidates
Key panels
The dashboard opens with a Detailed table view table and is then organized into four rows of top-N panels: Size stats, Activity stats, IO stats, and Estimated bloat stats.
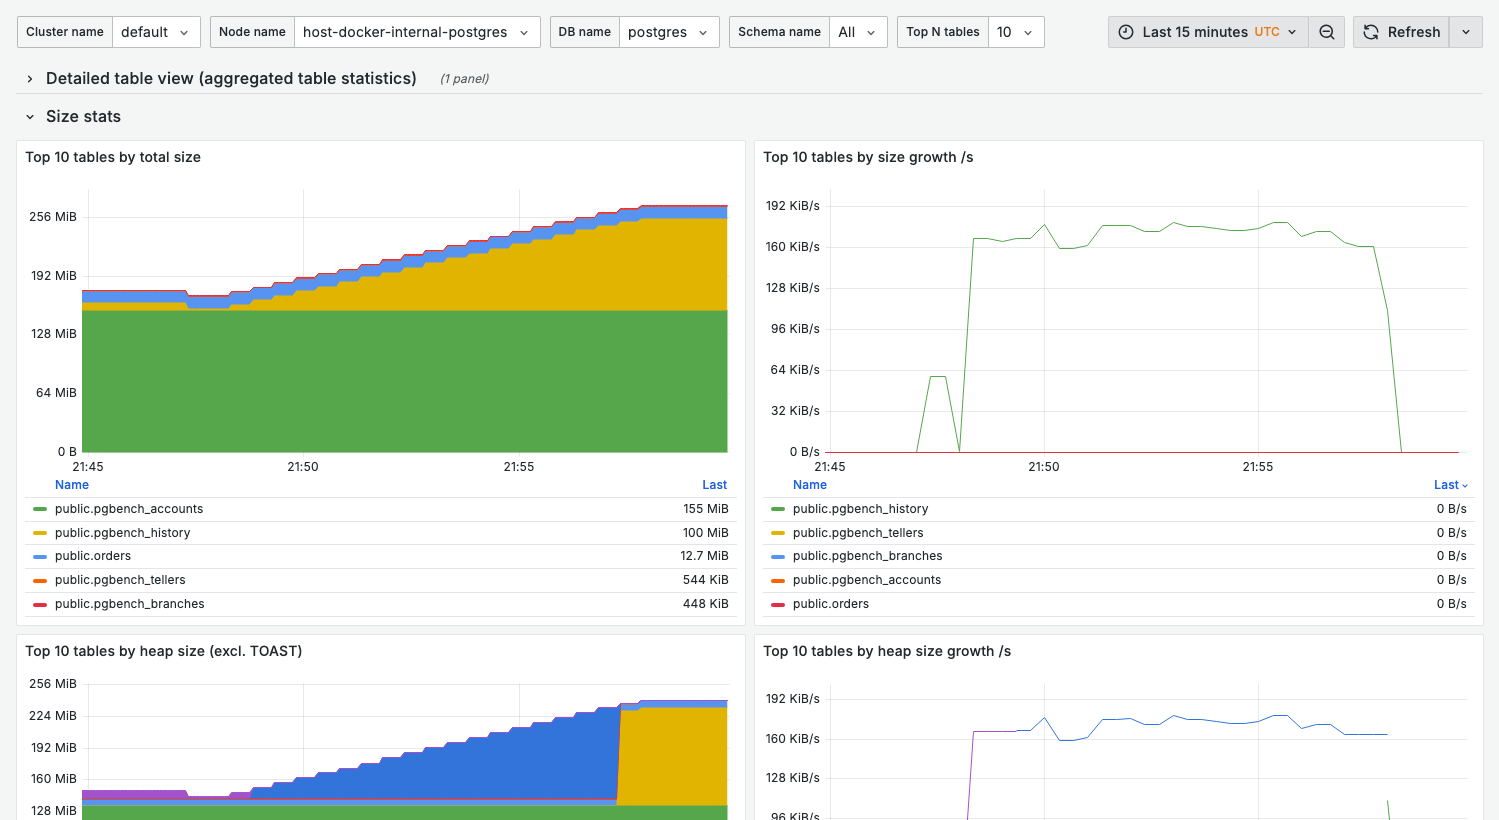
Size stats
What it shows:
- Top-N tables by total size, heap size (excl. TOAST), TOAST size, and indexes size
- A matching growth-per-second panel for each (total, heap, TOAST, indexes)
Use for:
- Capacity planning
- Identifying candidates for partitioning
- Storage optimization
Activity stats
What it shows:
- Top-N tables by tuple inserts, deletes, HOT updates, and non-HOT updates per second
- Top-N tables by sequential reads of live tuples and by index fetches of live tuples
Interpretation:
- High HOT updates vs non-HOT updates is good (HOT avoids index updates)
- Large tables high in sequential reads of live tuples may be missing indexes
IO stats
What it shows:
- Top-N tables by total/heap/TOAST/index shared block hits and reads
- Total shared block hit ratio and read ratio per table
Healthy state:
- High hit ratio for hot tables, minimal reads
Estimated bloat stats
What it shows:
- Top-N tables by estimated heap bloat % and by estimated heap bloat size
Variables
| Variable | Purpose |
|---|---|
cluster_name | Cluster filter |
node_name | Node filter |
db_name | Database filter |
schema_name | Schema filter |
top_n | Number of tables to show in top-N panels (5, 10, 15, 20, 50, 100) |
Per-relation panels use topk($top_n, ...) to show only the highest-ranked tables and drop the
long tail — they do not aggregate the remainder into a separate series. If the table you need is
not shown, raise top_n (or use 09. Single table).
See Top-N filtering.
Interpreting table metrics
Sequential vs index scans
select
  schemaname,
  relname,
  seq_scan,
  idx_scan,
  case
    when seq_scan + idx_scan = 0 then 0
    else round(100.0 * seq_scan / (seq_scan + idx_scan), 1)
  end as seq_scan_pct
from pg_stat_user_tables
where seq_scan + idx_scan > 100
order by seq_scan desc
limit 20;
High seq_scan_pct on large tables indicates missing indexes.
Table bloat estimation
Bloat shown in this dashboard is estimated based on:
- Dead tuple count
- Free space map
- Statistical sampling
For accurate bloat measurement, use the pgstattuple extension.
Related dashboards
- Single table deep-dive — 09. Single table
- Index analysis — 10. Index health
- Vacuum status — 07. Autovacuum
Troubleshooting
High sequential scan rate
-
Check if table has appropriate indexes:
select indexname, indexdef
from pg_indexes
where tablename = 'your_table'; -
Review query patterns accessing the table
-
Consider adding indexes for common filter columns
Table size growing unexpectedly
-
Check for bloat:
select
  relname,
  n_live_tup,
  n_dead_tup,
  round(100.0 * n_dead_tup / nullif(n_live_tup + n_dead_tup, 0), 1) as dead_pct
from pg_stat_user_tables
where relname = 'your_table'; -
Review autovacuum settings for the table
-
Check for long-running transactions blocking cleanup