11. Single index deep-dive
Detailed analysis of a specific index's usage and health.
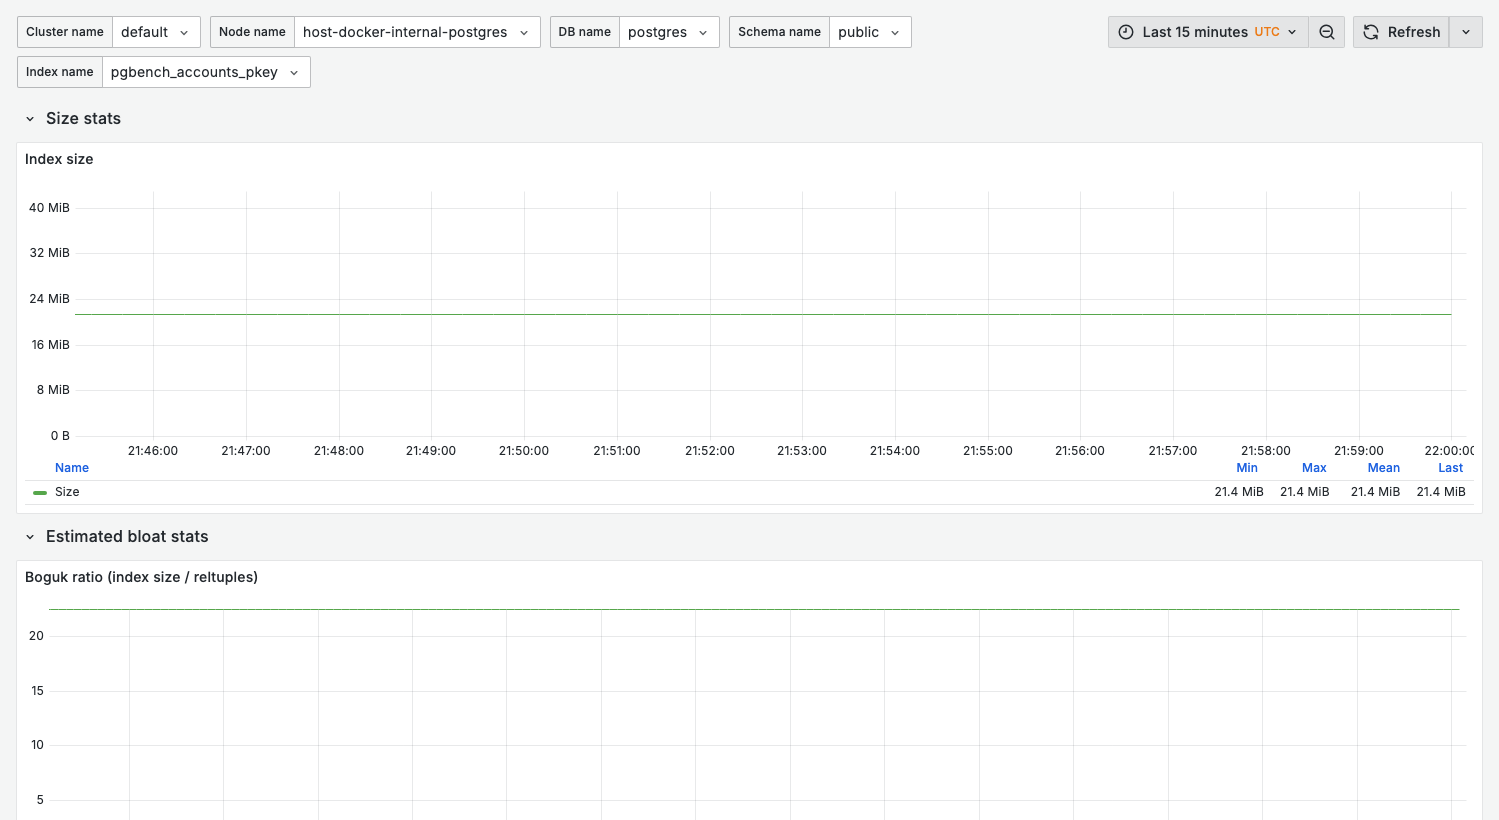
Screenshot note
This dashboard requires selecting a specific index from the dropdown. The screenshot shows the dashboard structure; actual data appears after selecting an index with collected statistics.
Purpose
When investigating a specific index from 10. Index Health, use this dashboard for:
- Usage pattern analysis
- Bloat assessment
- Maintenance planning
- Optimization decisions
When to use
- Deciding whether to drop an unused index
- Investigating index performance
- Planning index rebuild
- Validating new index effectiveness
Key panels
The dashboard is organized into four rows: Size stats, Index usage stats, IO stats, and Estimated bloat stats.
Index size
What it shows:
- Current index size
- Size trend over time
Index scans
What it shows:
- Scan frequency trend
- Helps identify usage patterns (batch jobs, peak hours)
Tuples read and fetched
What it shows:
idx_tup_read— tuples returned by indexidx_tup_fetch— tuples actually fetched from heap
Interpretation:
- Large gap may indicate index-only scans (good)
- Or visibility map issues requiring heap fetches
Shared block reads and hits
What it shows:
- Buffer reads and hits for this index over time
Healthy state:
- Hits dominate reads for a frequently used index
Boguk ratio (index size / reltuples)
What it shows:
- The Boguk ratio — index size divided by the table's estimated row count (
reltuples) — a bloat proxy in this dashboard's Estimated bloat stats row
Interpretation:
- A rising ratio over time suggests the index is bloating relative to the rows it covers
Variables
| Variable | Purpose |
|---|---|
cluster_name | Cluster filter |
node_name | Node filter |
datname | Database filter (label "DB name") |
schema_name | Schema filter |
index_name | Specific index to analyze |
Index information queries
Basic index info
select
  indexname,
  indexdef,
  pg_size_pretty(pg_relation_size(indexname::regclass)) as size
from pg_indexes
where indexname = 'your_index';
Index usage statistics
select
  indexrelname,
  idx_scan,
  idx_tup_read,
  idx_tup_fetch,
  pg_size_pretty(pg_relation_size(indexrelid)) as size
from pg_stat_user_indexes
where indexrelname = 'your_index';
Check if index supports constraints
-- Primary key or unique constraint
select
  conname,
  contype
from pg_constraint
where conindid = 'your_index'::regclass::oid;
Index bloat analysis
-- Requires pgstattuple extension
create extension if not exists pgstattuple;

select
  avg_leaf_density,
  leaf_fragmentation
from pgstatindex('your_index');
Decision framework
Should I drop this index?
| Condition | Action |
|---|---|
| Zero scans, no constraint | Safe to drop |
| Zero scans, has constraint | Keep (enforces uniqueness) |
| Low scans, used by batch job | Keep (check longer time range) |
| Redundant (subset of another) | Safe to drop |
| High bloat, frequently used | Rebuild, don't drop |
Rebuild vs drop and recreate
| Scenario | Recommendation |
|---|---|
| Minor bloat (< 30%) | Let autovacuum handle |
| Moderate bloat (30-50%) | reindex concurrently |
| Severe bloat (> 50%) | Drop and recreate |
| Production, no downtime | reindex concurrently |
Related dashboards
- All indexes — 10. Index Health
- Parent table — 09. Single Table
- Queries using this index — 02. Query Analysis
Troubleshooting
Index not in dropdown
-
Verify index exists:
select * from pg_indexes where indexname = 'your_index'; -
Check it's a user index (not system catalog)
Metrics show unexpected values
Index statistics are cumulative since last reset. Check reset time:
select stats_reset from pg_stat_database where datname = current_database();