02. Query performance analysis (top-N)
Comprehensive query performance dashboard showing top queries by various metrics.
Purpose
Identify the most resource-intensive queries across multiple dimensions:
- Call frequency
- Execution time
- Planning time
- Rows processed
- Shared buffer usage
When to use
- Regular query performance reviews
- Investigating slow application responses
- Finding optimization candidates
- Before/after index changes
Key panels
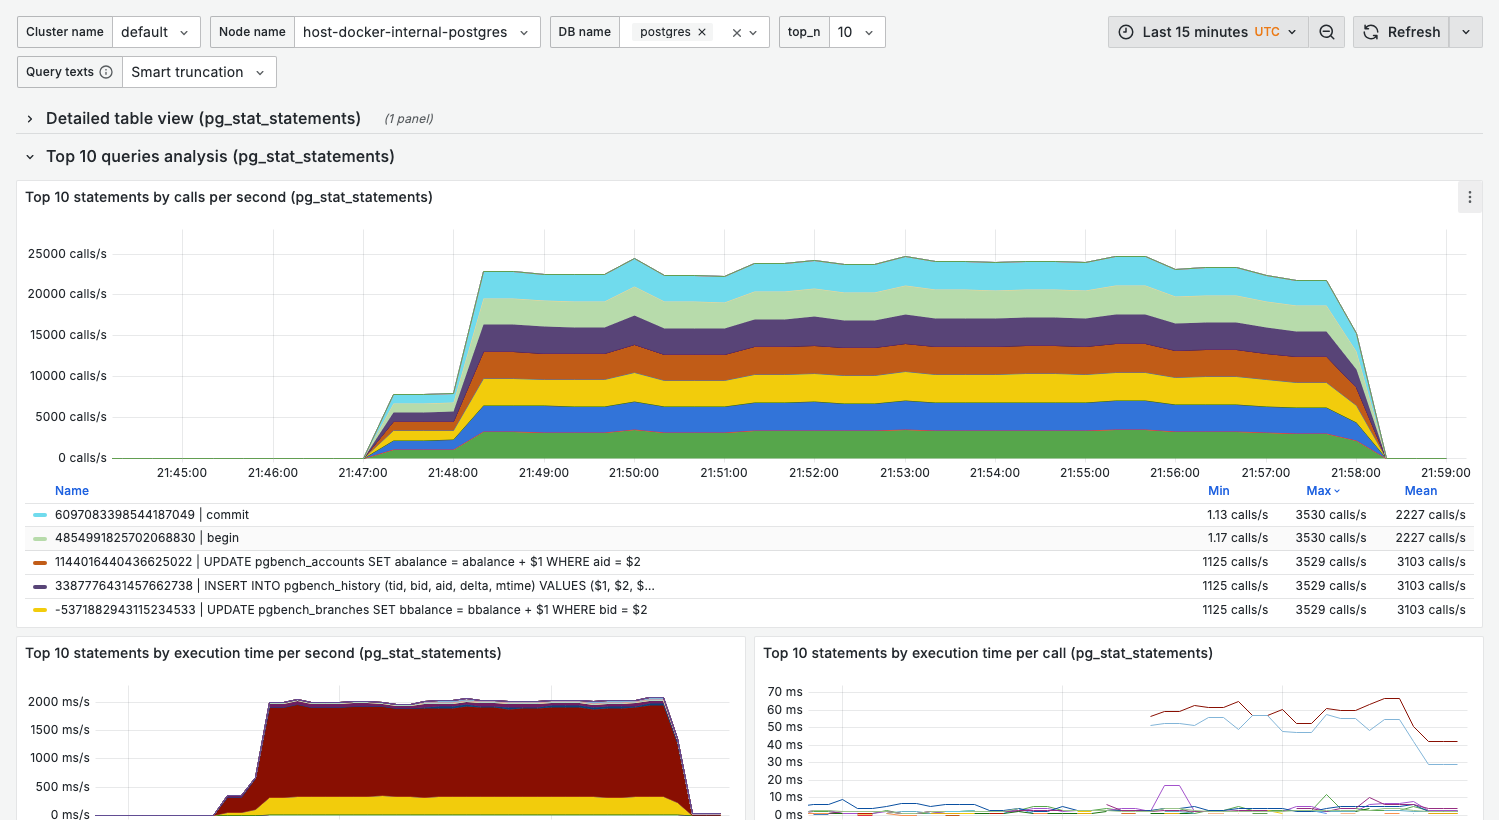
Top 10 statements by calls per second
What it shows:
- Most frequently executed queries
- Rate of calls over time
Interpretation:
- High-frequency queries are prime optimization targets
- Even small improvements have large cumulative impact
- Sudden spikes may indicate application issues
Top 10 statements by execution time per second
What it shows:
- Queries consuming the most total execution time
- Combines frequency × duration
This is often the most important panel — queries here have the highest overall impact on database load.
Interpretation:
- A query appearing here but not in "calls/sec" = slow but infrequent
- A query appearing here and in "calls/sec" = high priority for optimization
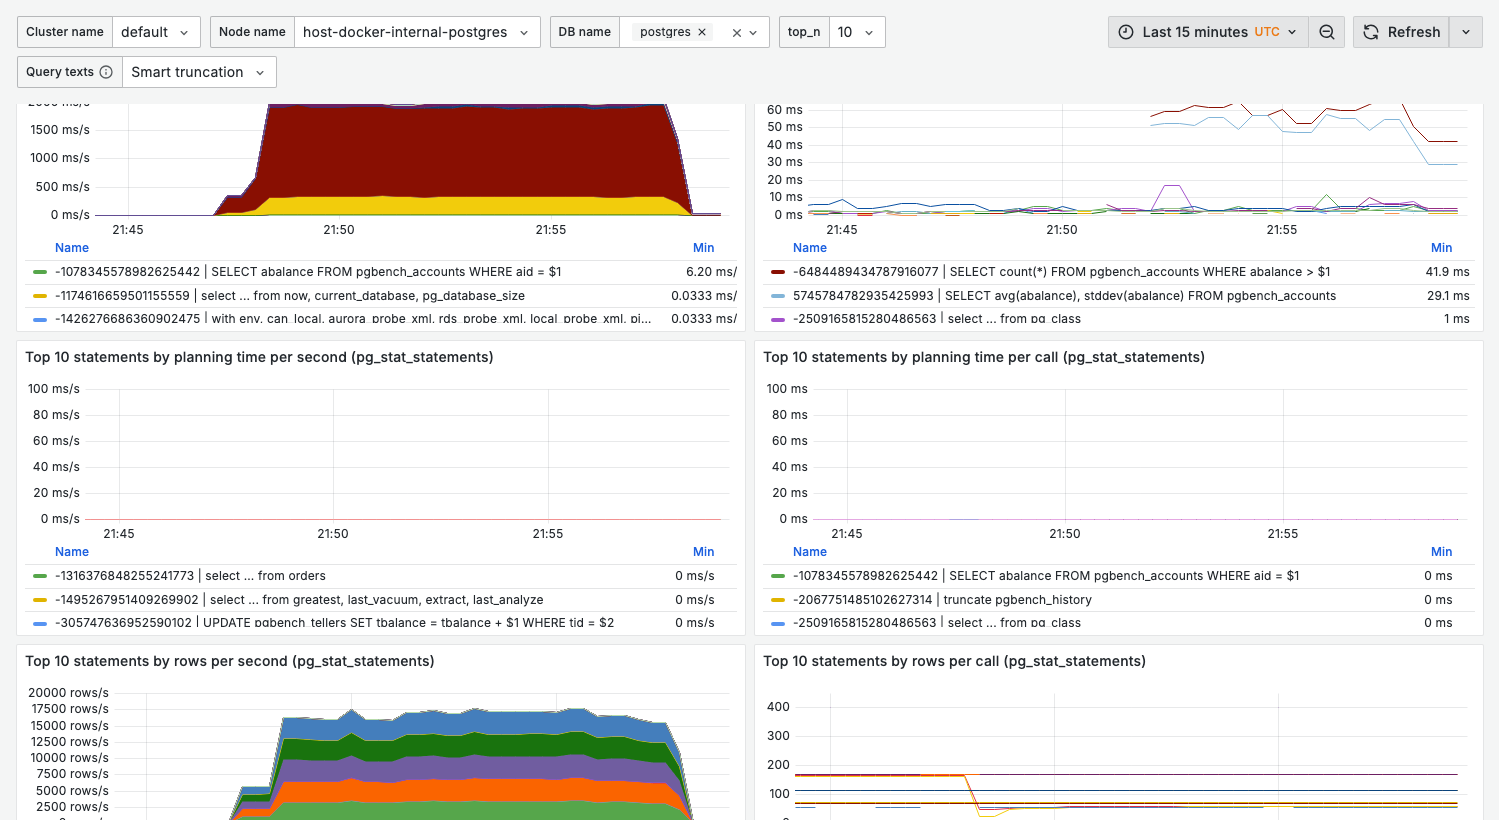
Top 10 statements by execution time per call
What it shows:
- Average duration per query execution
- Identifies slow individual queries
Healthy range:
- OLTP queries: < 100ms
- Reporting queries: < 5s (depends on complexity)
Warning signs:
- Queries over 1s in OLTP workloads
- Increasing trend over time (regression)
Top 10 statements by planning time
What it shows:
- Time spent in query planning
- High values indicate complex query structures
When planning time matters:
- Very short-lived queries (OLTP)
- Queries with many JOINs
- Dynamic SQL with different parameters
Top 10 statements by rows
What it shows:
- Queries processing the most rows
- Rows returned vs rows scanned
Warning signs:
- Large gap between rows scanned and returned = missing indexes
- Very high row counts = potential full table scans
Top 10 statements by shared buffers
What it shows:
- Buffer cache hits and reads
- Memory pressure indicators
Healthy state:
- High hit ratio (> 99%)
- Reads should be minimal for hot data
Variables
| Variable | Purpose | Options |
|---|---|---|
cluster_name | Cluster filter | Your clusters |
node_name | Node filter | Specific nodes |
db_name | Database filter | Filter by database |
top_n | Number of queries | 5, 10, 15, 20, 50, 100, 500 |
legend_label | Query display format | See below |
Legend label options
The legend_label variable (Query texts) has two options:
| Option | Value | Shows |
|---|---|---|
| Smart truncation (default) | displayname_long | Query text with smart truncation |
| Raw texts | displayname_raw_long | Full raw query text |
Switch to Raw texts (displayname_raw_long) when you need the complete, untruncated query text.
Detailed table view
Expand the Detailed table view section for a tabular breakdown including:
- Query ID
- Query text
- Calls
- Exec time (ms)
- Exec time/call (ms)
- Rows
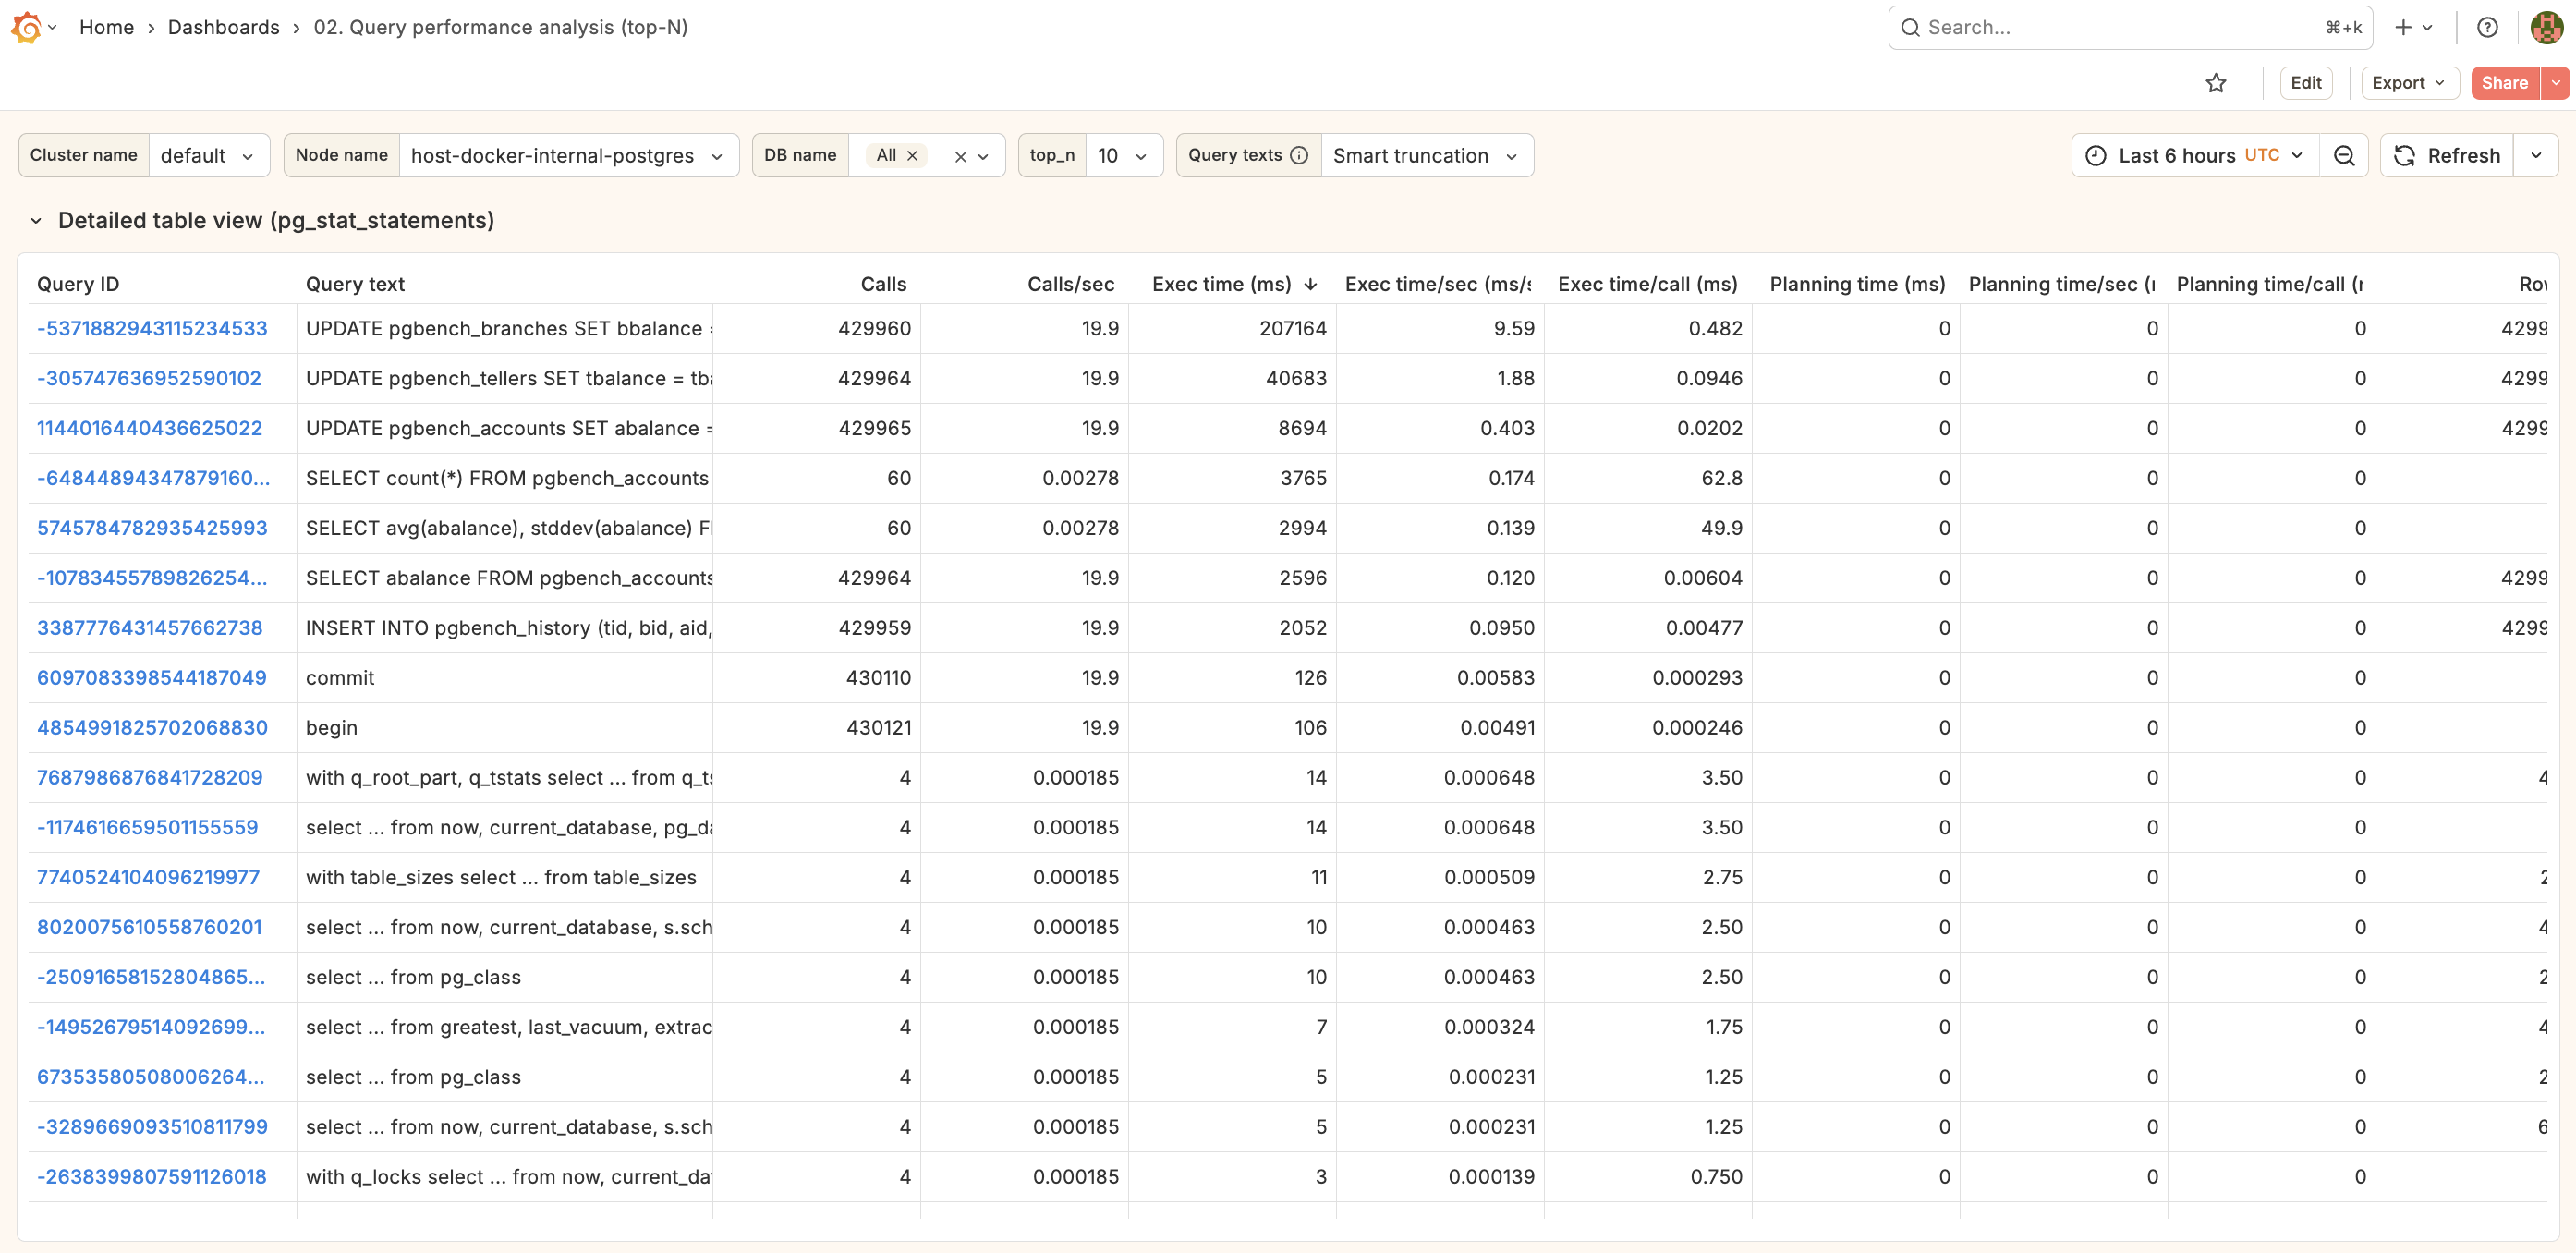
Click any row to drill down to 03. Single query.
Query text integration
The dashboard shows actual query text (not just queryid) by:
- Joining metrics with
pg_stat_statementsvia the Flask backend - Smart truncation for readability
- Full text available in tooltips and detail view
Related dashboards
- Single query deep-dive — 03. Single query
- Wait events for specific query — 04. Wait events
- Table statistics — 08. Table stats
Troubleshooting
Query texts show as "unknown" or queryid only
-
Check the Flask backend is running. It is not published to the host, so check from inside the container. The backend image is
python:3.11-slimand has nocurl, so hit the endpoint with the bundled Python interpreter:docker compose exec monitoring_flask_backend \
python -c "import urllib.request,sys; sys.exit(0 if urllib.request.urlopen('http://localhost:8000/health').status==200 else 1)" -
Verify pg_stat_statements has data:
select count(*) from pg_stat_statements; -
Check backend logs:
docker compose logs monitoring_flask_backend
Metrics don't match pg_stat_statements directly
Dashboard shows rates (per second), not cumulative totals. For raw totals:
select query, calls, total_exec_time
from pg_stat_statements
order by total_exec_time desc
limit 10;
New queries not appearing
pg_stat_statements may need time to accumulate data for new queries. Check:
select pg_stat_statements_reset(); -- caution: resets all stats
Or wait for the next collection interval. pg_stat_statements is collected every 30s by default
in the full preset (activity metrics such as pg_stat_activity and wait_events every 15s).