09. Single table analysis
Detailed analysis of a specific table's performance and health metrics.
Screenshot note
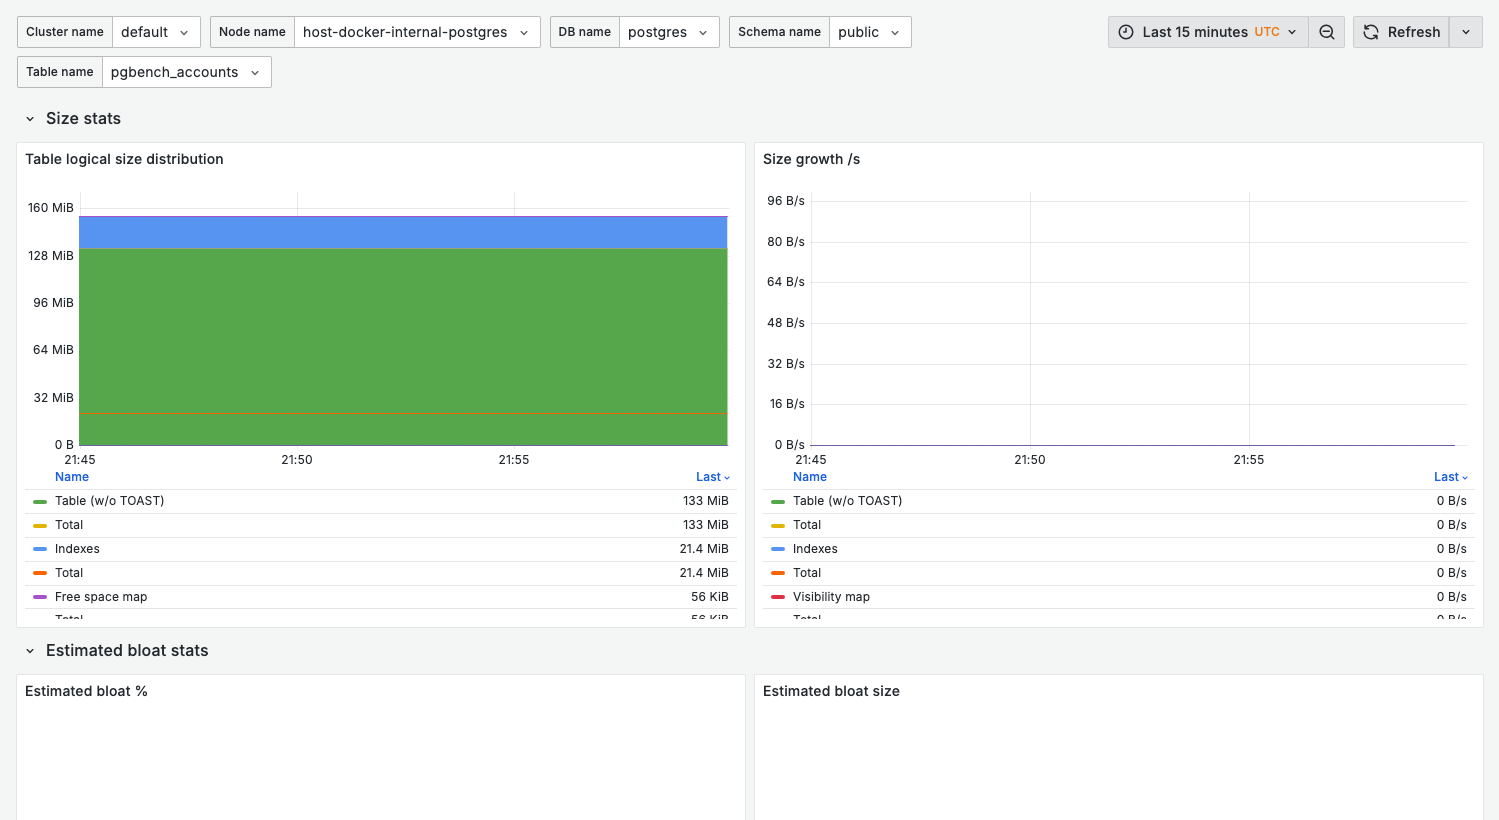
This dashboard requires selecting a specific table from the dropdown. The screenshot shows the dashboard structure; actual data appears after selecting a table with collected statistics.
Purpose
When you've identified a problematic table in 08. Table Stats, use this dashboard for:
- Detailed access pattern analysis
- Bloat investigation
- Index usage review
- Maintenance planning
When to use
- Investigating slow queries on a specific table
- Planning table maintenance (vacuum, reindex)
- Before/after schema changes
- Capacity planning for growing tables
Key panels
The dashboard is organized into four rows: Size stats, Estimated bloat stats, Activity stats, and IO stats.
Size stats
What it shows:
- Table logical size distribution — the logical size of the table over time
- Size growth /s — the rate of size change
Use for:
- Capacity forecasting
- Detecting unexpected growth
- Measuring impact of cleanup operations
Estimated bloat stats
What it shows:
- Estimated bloat % and Estimated bloat size for the table
Activity stats
What it shows:
- Tuple operations /s — inserts, updates (HOT and non-HOT), and deletes per second
- Tuple operations distribution (%) — the same operations as a share of the total
- Tuple fetch methods /s — sequential vs index access over time
Improving HOT ratio:
-- Increase fillfactor to leave room for updates
alter table your_table set (fillfactor = 80);
IO stats
What it shows:
- Shared block hits /s and Shared block reads /s
- Shared block hit ratio
Healthy pattern:
- High hit ratio, minimal reads for hot tables
Variables
| Variable | Purpose |
|---|---|
cluster_name | Cluster filter |
node_name | Node filter |
db_name | Database filter |
schema_name | Schema filter |
table_name | Specific table to analyze |
Table information queries
Basic table info
select
  pg_size_pretty(pg_total_relation_size(oid)) as total_size,
  pg_size_pretty(pg_relation_size(oid)) as table_size,
  pg_size_pretty(pg_indexes_size(oid)) as indexes_size,
  reltuples::bigint as estimated_rows
from pg_class
where relname = 'your_table';
Table access statistics
select
  seq_scan,
  seq_tup_read,
  idx_scan,
  idx_tup_fetch,
  n_tup_ins,
  n_tup_upd,
  n_tup_del,
  n_tup_hot_upd,
  n_live_tup,
  n_dead_tup
from pg_stat_user_tables
where relname = 'your_table';
Table bloat check
select
  relname,
  n_dead_tup,
  n_live_tup,
  round(100.0 * n_dead_tup / nullif(n_live_tup, 0), 2) as dead_ratio_pct,
  last_vacuum,
  last_autovacuum
from pg_stat_user_tables
where relname = 'your_table';
Related dashboards
- All tables overview — 08. Table Stats
- Indexes on this table — 10. Index Health
- Queries accessing this table — 02. Query Analysis
Troubleshooting
Table not appearing in dropdown
- Verify the table exists in the selected database
- Check monitoring user has access:
select has_table_privilege('pgwatch', 'your_table', 'select');
Metrics show zero
Some metrics require activity to populate:
- Run queries against the table
- Wait for next metrics collection cycle (table stats collect every 30s by default)
Size metrics don't match pg_relation_size
Dashboard may show cached values. For real-time size:
select pg_size_pretty(pg_total_relation_size('your_table'));