01. Single node performance overview
High-level dashboard for quick triage and overall database health assessment.
Purpose
This dashboard provides a "shallow but wide" view of database performance, ideal for:
- Incident response: Quickly identify which subsystem is problematic
- Daily health checks: Spot anomalies at a glance
- Capacity planning: Track growth trends
When to use
- First dashboard to check during any performance incident
- Morning health check routine
- Before and after maintenance windows
- When users report "the database is slow"
Key panels
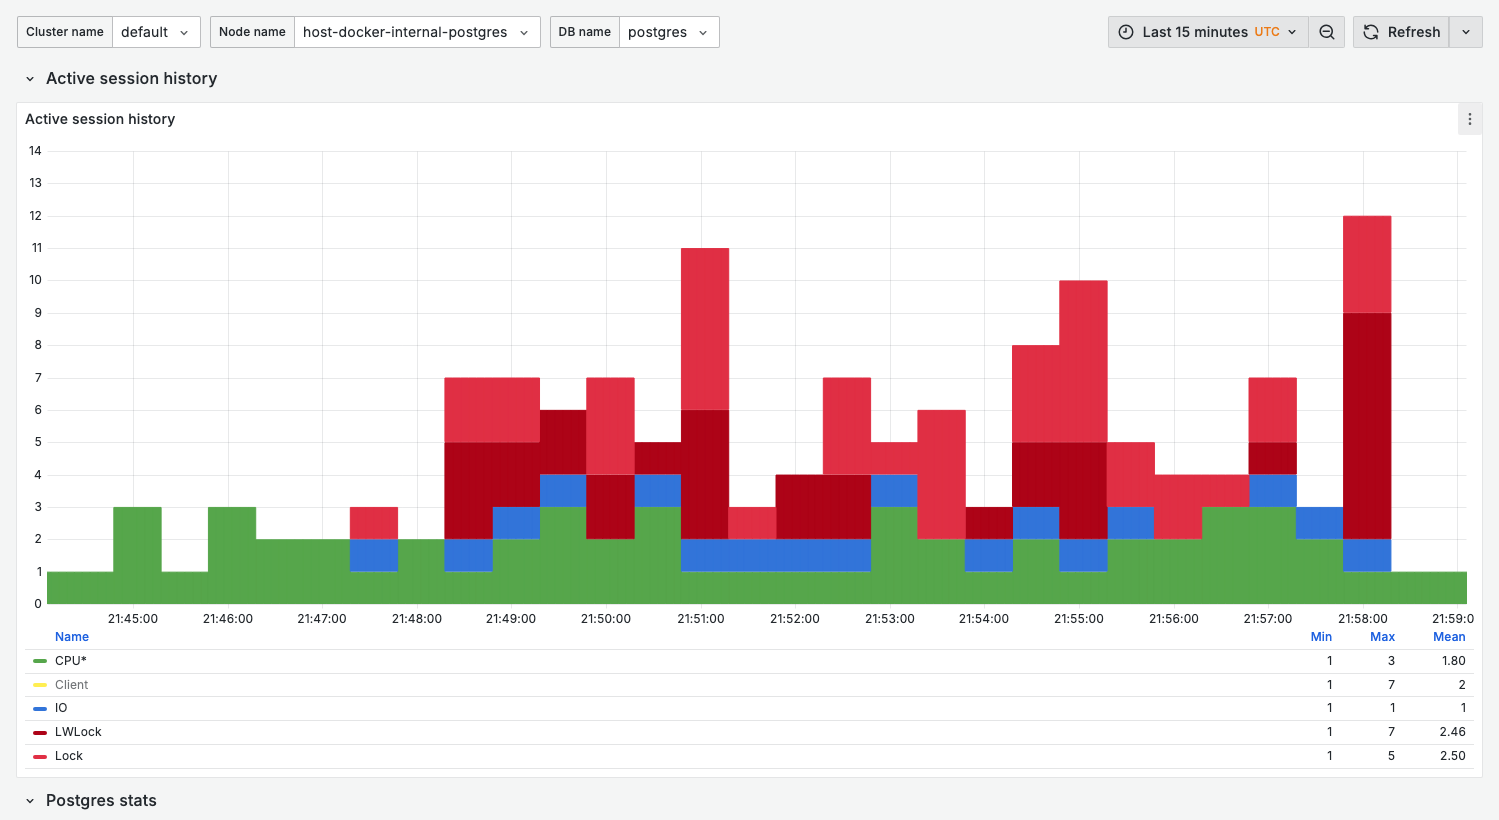
Active session history
Similar to AWS RDS Performance Insights, this panel shows wait event distribution over time.
What it shows:
- Stacked bar chart of active sessions by wait event category
- Each bar represents a sampling interval
Wait event categories:
| Category | Color | Indicates |
|---|---|---|
| CPU* | Green | On-CPU activity (query execution) |
| IO | Blue | Disk I/O waits |
| Lock | Red | Row/table lock waits |
| LWLock | Dark red | Lightweight lock contention |
| Timeout | Brown (#6f450c) | Sleep/timeout events |
Healthy state:
- Mostly green (CPU) with occasional blue (IO)
- Total height below
max_connections * 0.5
Warning signs:
- Sustained dark red (LWLock) — Internal contention
- Sustained red (Lock) — Application-level locking issues
- Spikes above normal baseline — Sudden load increase
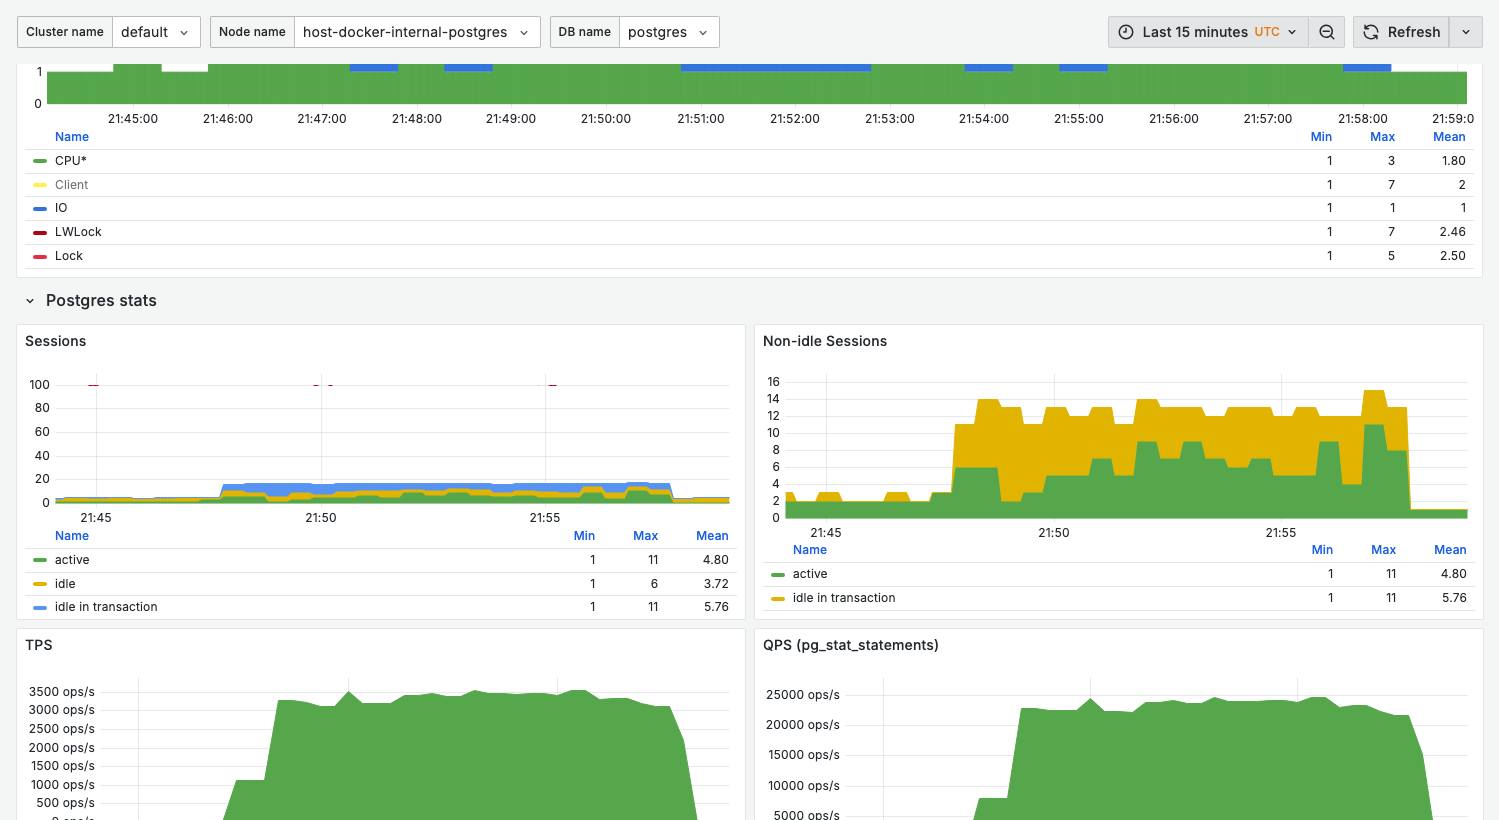
Sessions
What it shows:
- Current session count by state
active: Executing queriesidle: Connected but not executingidle in transaction: In transaction, not executing
Healthy range:
active< 20-50 (depending on workload)idle in transactionshould be minimal (< 5)
Warning signs:
- High
idle in transaction— Connection leaks or long transactions activenearmax_connections— Connection exhaustion
Non-idle sessions
Focused view of sessions doing actual work.
Healthy state:
- Stable pattern matching application load
- No sudden spikes without corresponding application events
TPS
What it shows:
- Transactions per second: commit rate
- Rollback rate (if significant)
Use for:
- Capacity baseline
- Detecting throughput drops
QPS (pg_stat_statements)
From pg_stat_statements, showing actual query execution rate.
Note: QPS typically higher than TPS since one transaction contains multiple queries.
Variables
| Variable | Purpose | Options |
|---|---|---|
cluster_name | Cluster filter | Your cluster names |
node_name | Node filter | node-01, replica-01, etc. |
db_name | Database filter | Database names or All |
Related dashboards
- High wait events? — 04. Wait events for ASH-style deep-dive
- Query issues? — 02. Query analysis for top queries
- Lock problems? — 13. Lock contention for blocking analysis
Troubleshooting
No data in ASH (Active Session History)
-
Verify pgwatch is collecting metrics:
docker compose logs pgwatch-postgres pgwatch-prometheus | grep -i "wait\|session" -
Check VictoriaMetrics has wait-event data backing the ASH panel (host port
59090, VM basic auth):curl -u "$VM_AUTH_USERNAME:$VM_AUTH_PASSWORD" \
'http://localhost:59090/api/v1/query?query=pgwatch_wait_events_total'
Sessions count doesn't match pg_stat_activity
The dashboard samples at intervals. For real-time view, query directly:
select state, count(*)
from pg_stat_activity
where backend_type = 'client backend'
group by state;